
add assets
#13
by
nouamanetazi
HF Staff
- opened
- assets/images/activation_recomputation.png +3 -0
- assets/images/conclusion_llama3_parallelism.png +3 -0
- assets/images/dp_diagram.png +3 -0
- assets/images/ep_schema.png +3 -0
- assets/images/flashattn.png +3 -0
- assets/images/flashattn2.png +3 -0
- assets/images/fp8_diagram.png +3 -0
- assets/images/fp8_divergence.png +3 -0
- assets/images/fused_kernels1.png +3 -0
- assets/images/fused_kernels2.png +3 -0
- assets/images/gradaccumulation_diag.png +3 -0
- assets/images/memorycoalescing.png +3 -0
- assets/images/memorycoalescing2.png +3 -0
- assets/images/memorycoalescing3.png +3 -0
- assets/images/memorycoalescing4.png +3 -0
- assets/images/memorycoalescing5.png +3 -0
- assets/images/mixedprecision.png +3 -0
- assets/images/mixedprecision_2.png +3 -0
- assets/images/pp_1f1b_scaling.png +3 -0
- assets/images/pp_bubblesize.png +3 -0
- assets/images/pp_llama3.1_schedule.png +3 -0
- assets/images/pp_zerobubble_compgraph.png +3 -0
- assets/images/pp_zerobubble_dualpipe.png +3 -0
- assets/images/pp_zerobubble_ppschedule.png +3 -0
- assets/images/ring-attention.gif +0 -0
- assets/images/threadcoarsening.png +3 -0
- assets/images/tiling.png +3 -0
- assets/images/tp_diagram.png +3 -0
- assets/images/tp_diagram2.png +3 -0
- assets/images/tp_diagram3.png +3 -0
- assets/images/tp_diagram4.png +3 -0
- assets/images/tp_full_diagram.png +3 -0
- assets/images/tp_sp_diagram.png +3 -0
- assets/images/tp_sp_diagram_zoomed.png +3 -0
- src/index.html +86 -76
assets/images/activation_recomputation.png
ADDED

|
Git LFS Details
|
assets/images/conclusion_llama3_parallelism.png
ADDED

|
Git LFS Details
|
assets/images/dp_diagram.png
ADDED

|
Git LFS Details
|
assets/images/ep_schema.png
ADDED

|
Git LFS Details
|
assets/images/flashattn.png
ADDED
|
Git LFS Details
|
assets/images/flashattn2.png
ADDED

|
Git LFS Details
|
assets/images/fp8_diagram.png
ADDED
|
Git LFS Details
|
assets/images/fp8_divergence.png
ADDED
|
Git LFS Details
|
assets/images/fused_kernels1.png
ADDED
|
Git LFS Details
|
assets/images/fused_kernels2.png
ADDED
|
Git LFS Details
|
assets/images/gradaccumulation_diag.png
ADDED

|
Git LFS Details
|
assets/images/memorycoalescing.png
ADDED
|
Git LFS Details
|
assets/images/memorycoalescing2.png
ADDED

|
Git LFS Details
|
assets/images/memorycoalescing3.png
ADDED
|
Git LFS Details
|
assets/images/memorycoalescing4.png
ADDED

|
Git LFS Details
|
assets/images/memorycoalescing5.png
ADDED

|
Git LFS Details
|
assets/images/mixedprecision.png
ADDED

|
Git LFS Details
|
assets/images/mixedprecision_2.png
ADDED
|
Git LFS Details
|
assets/images/pp_1f1b_scaling.png
ADDED
|
Git LFS Details
|
assets/images/pp_bubblesize.png
ADDED
|
Git LFS Details
|
assets/images/pp_llama3.1_schedule.png
ADDED

|
Git LFS Details
|
assets/images/pp_zerobubble_compgraph.png
ADDED

|
Git LFS Details
|
assets/images/pp_zerobubble_dualpipe.png
ADDED
|
Git LFS Details
|
assets/images/pp_zerobubble_ppschedule.png
ADDED

|
Git LFS Details
|
assets/images/ring-attention.gif
ADDED
|
assets/images/threadcoarsening.png
ADDED

|
Git LFS Details
|
assets/images/tiling.png
ADDED

|
Git LFS Details
|
assets/images/tp_diagram.png
ADDED

|
Git LFS Details
|
assets/images/tp_diagram2.png
ADDED
|
Git LFS Details
|
assets/images/tp_diagram3.png
ADDED
|
Git LFS Details
|
assets/images/tp_diagram4.png
ADDED
|
Git LFS Details
|
assets/images/tp_full_diagram.png
ADDED

|
Git LFS Details
|
assets/images/tp_sp_diagram.png
ADDED

|
Git LFS Details
|
assets/images/tp_sp_diagram_zoomed.png
ADDED

|
Git LFS Details
|
src/index.html
CHANGED
|
@@ -415,7 +415,7 @@
|
|
| 415 |
|
| 416 |
<p>An interesting observation here is how the memory is not static for a given model but it scales linearly with both the sequence length and batch size. This means the activation memory is the part which will blow up when we increase our batch size or train with longer sequences. We can use this equation to look at how memory usage changes for various sequence lengths for example for Llama models (<code>bs=1</code>):</p>
|
| 417 |
|
| 418 |
-
<p><img alt="
|
| 419 |
|
| 420 |
<p>This graph tells a striking story: for short sequences (or similar for small batch-sizes), activations are almost negligible, but starting at around 2-4k tokens they come to take a significant amount of memory while parameter, gradient and optimizer states usage (that we’ll discuss later) stays roughly independent of the sequence length and batch size.</p>
|
| 421 |
|
|
@@ -429,7 +429,7 @@
|
|
| 429 |
|
| 430 |
<p>The general idea behind <strong><em>activation recomputation</em></strong> – also called <em>gradient checkpointing</em> or <em>rematerialization</em> – is to discard some activations during the forward pass to save memory and spend some extra compute to recompute these on the fly during the backward pass. Without recomputation, we store every hidden state between two learnable operations (e.g. FF, LayerNorm etc.), such that we can use them during the backward pass to compute gradients. When we use recomputation we typically will only store activations at a few key points along the model architecture, discard the rest of activations and recompute them on the fly during the backward pass from the nearest saved activations, basically performing again a sub-part of the forward pass to trade of memory for compute. It generally looks like this:</p>
|
| 431 |
|
| 432 |
-
<p><img alt="image.png" src="/assets/images/
|
| 433 |
|
| 434 |
<p>There are several strategies to select key activations to store:</p>
|
| 435 |
|
|
@@ -489,7 +489,7 @@
|
|
| 489 |
|
| 490 |
<p>Gradient accumulation allows us to effectively increase our batch size up to infinity (and beyond!) while the memory footprint stays constant. Gradient accumulation is also compatible with activation recomputation for further memory reduction. One drawback however, is that gradient accumulation requires multiple consecutive forward/backward passes per optimization step thereby increasing the compute overhead and slowing down training. No free lunch! </p>
|
| 491 |
|
| 492 |
-
<p><img alt="image.png" src="/assets/images/
|
| 493 |
|
| 494 |
<aside>Using gradient accumulation means we need to keep buffers where we accumulate gradients which persist throughout a training step. Whereas without gradient accumulation, in the backward gradients are computed while freeing the activations memory, which means a lower peak memory.</aside>
|
| 495 |
|
|
@@ -508,13 +508,13 @@
|
|
| 508 |
|
| 509 |
<p>Using a different micro batch for each GPU means we’ll have different gradients in each GPU, so to keep the model instances in sync across different GPUs, the gradients from the model instances are averaged using an operation called “all-reduce”, which happens during the backward pass, before the optimizer step.</p>
|
| 510 |
|
| 511 |
-
<p><img alt="image.png" src="/assets/images/
|
| 512 |
|
| 513 |
<aside>If you are not familiar with distributed communications patterns like broadcast, gather or all-reduce we put together a small crash course in the Appendix [TODO Link].</aside>
|
| 514 |
|
| 515 |
<p>This involves our first “distributed communication” primitive: <em><strong>all-reduce</em></strong> which handles the synchronization and communication between GPU instances and nodes.</p>
|
| 516 |
|
| 517 |
-
<p><img alt="image.png" src="/assets/images/
|
| 518 |
|
| 519 |
<p>A naive DP implementation would just wait for the backward pass the finish so that we have all gradients, then it triggers an all-reduce over all DP ranks, to sync these gradients. But such an sequential steps of computation followed by communication is <strong>A BIG NO!</strong> Because we don’t want our GPUs to stay idle while communication is happening.</p>
|
| 520 |
|
|
@@ -540,7 +540,7 @@
|
|
| 540 |
if p.requires_grad is True:
|
| 541 |
p.register_post_accumulate_grad_hook(hook)</d-code>
|
| 542 |
|
| 543 |
-
<p><img alt="image.png" src="/assets/images/
|
| 544 |
|
| 545 |
<p>Overlapping computation and communication reduces the time spent waiting for gradient synchronization across the entire model. Gradient synchronization can occur (at least partially) in parallel with backward pass, significantly speeding up data parallelism. Here's a full implementation of naive DP with synchronization overlap:</p>
|
| 546 |
|
|
@@ -574,7 +574,7 @@
|
|
| 574 |
</div>
|
| 575 |
</details>
|
| 576 |
|
| 577 |
-
<p><img alt="
|
| 578 |
|
| 579 |
<h4><strong>Third optimization: </strong>Interplay with gradient accumulation</h4>
|
| 580 |
|
|
@@ -634,7 +634,7 @@
|
|
| 634 |
|
| 635 |
<p>While data parallelism cleverly overlaps the all-reduce gradient synchronization with backward computation to save time, this benefit starts to break down at large scales. As we add more and more GPUs (hundreds or thousands), the overhead of coordinating between them grows significantly. The end result? We get less and less efficient returns from each additional GPU we add to the system:</p>
|
| 636 |
|
| 637 |
-
<p><img alt="image.png" src="/assets/images/
|
| 638 |
|
| 639 |
<p>As expected, we can also see that the memory usage per GPU is not affected by adding more DP ranks for training.</p>
|
| 640 |
|
|
@@ -642,7 +642,7 @@
|
|
| 642 |
|
| 643 |
<p>The keen reader has already probably noted however that this assumes that we can fit at least one input sample forward pass (mbs<em>=1)</em> into our GPU memory. This is not always the case! As we can see, larger models don’t fit into a single GPU, even with activation recomputation activated: </p>
|
| 644 |
|
| 645 |
-
<p><img alt="
|
| 646 |
|
| 647 |
<aside>Tip: you can quickly eyeball the minimal memory required for your model’s parameters by multiplying by 2 e.g. 70B → 140GB (=133GiB)</aside>
|
| 648 |
|
|
@@ -688,7 +688,7 @@
|
|
| 688 |
|
| 689 |
<p>The idea of ZeRO is to shard these objects across the DP ranks, each node only storing a slice of the items which are reconstructed when and if needed, thereby dividing memory usage by the data parallel degree <d-math>N_d</d-math>:</p>
|
| 690 |
|
| 691 |
-
<p><img alt="
|
| 692 |
<p>Memory consumption of DP and three stages of Zero-DP. <d-math>\Psi</d-math> denotes number of parameters, <d-math>k</d-math> denotes the memory multiplier of optimizer states (<d-math>k=12</d-math> for Adam), and <d-math>N_d</d-math> denotes DP degree.</p>
|
| 693 |
|
| 694 |
|
|
@@ -714,11 +714,11 @@
|
|
| 714 |
|
| 715 |
<p>See the figure below for all the necessary steps in one forward/backward pass cycle:</p>
|
| 716 |
|
| 717 |
-
<p><img alt="
|
| 718 |
|
| 719 |
<p>So in practice, compared to vanilla DP, Zero-1 adds an all-gather over all parameters after the optimizer step as we can see below:</p>
|
| 720 |
|
| 721 |
-
<p><img alt="
|
| 722 |
|
| 723 |
<p>If you've been following along, you'll recall from vanilla DP that we can overlap the all-reduce gradient communication with the backward pass computation. In ZeRO-1, we can also investigate how to efficiently overlap the newly added all-gather of bf16 parameters. There are two main strategies for this:</p>
|
| 724 |
|
|
@@ -742,13 +742,13 @@
|
|
| 742 |
|
| 743 |
<aside>In case of FP32 gradient accumulation, we only need to keep <d-math>\frac{1}{N_d}</d-math> fp32_grads where we accumulate the bf16 grads coming from the reduce-scatter. And in the optimizer step we use the <d-math>\frac{1}{N_d}</d-math> fp32_grads.</aside>
|
| 744 |
|
| 745 |
-
<p><img alt="
|
| 746 |
|
| 747 |
<p>It’s easy to see now that sharding the gradients leads to to <d-math>2\Psi + \frac{2\Psi+k\Psi}{N_d}</d-math> and as <d-math>N_d</d-math> is increased we can save up to 8x memory over the baseline. In terms of communication the same process applies as for ZeRO-1, with the only difference that we communicate and release on the fly. In total, ZeRO-2 is thus also equivalent to vanilla DP training w.r.t. communication.</p>
|
| 748 |
|
| 749 |
<p>In terms of communication ZeRO-2 is similar to ZeRO-1, they both require a reduce-scatter for the gradients, and an all-gather over all parameters.</p>
|
| 750 |
|
| 751 |
-
<p><img alt="
|
| 752 |
|
| 753 |
<aside>Note: You might notice that there is no real overhead of using ZeRO-2 over ZeRO-1 and indeed ZeRO-2 is usually the best option.</aside>
|
| 754 |
|
|
@@ -767,13 +767,15 @@
|
|
| 767 |
|
| 768 |
<p>So how do we do a forward or backward pass in practice if all parts of the model are distributed? Quite simply we gather them on-demand when we need them. In the forward pass this looks as follows:</p>
|
| 769 |
|
| 770 |
-
<p><img alt="
|
| 771 |
|
| 772 |
-
<p>So as we perform the forward pass and sequentially go through the layers we retrieve the necessary parameters on demand and immediately flush them from memory when we don
|
| 773 |
|
| 774 |
-
<p><img alt="
|
| 775 |
|
| 776 |
-
|
|
|
|
|
|
|
| 777 |
|
| 778 |
<p>During the forward pass we do all-gather operations for the parameters when we need them, so a <d-math>\Psi</d-math> communication tax. Since we discard the parameters immediately after we needed them in the forward pass we need one more all-gather during the backward pass as well incurring another <d-math>\Psi</d-math> in communication tax. Finally we need the same <strong><em>reduce-scatter</em></strong> as in ZeRO-2 for the gradients which costs also <d-math>\Psi</d-math> in communication and we arrive at a total communication cost of <d-math>3\Psi</d-math>, compared to <d-math>2\Psi</d-math> for Zero-2.</p>
|
| 779 |
|
|
@@ -788,7 +790,7 @@
|
|
| 788 |
|
| 789 |
<p>However, there is a limit here, DP only works if a layer of the model fits in a single GPU and ZeRO can only partition the parameters, gradients, and optimizer states, but not the activation memory! Recall from the activation memory discussion that it scales with sequence length and batch size. Naturally we could just limit those, but in practice we don’t want to be limited by hardware to train with only with a short sequence length. </p>
|
| 790 |
|
| 791 |
-
<p><img alt="
|
| 792 |
|
| 793 |
<p>Now that we've efficiently used the DP axis to reduce memory through efficient communication patterns, let's explore a new, orthogonal axis of parallelism - Tensor Parallelism. Unlike ZeRO3 that relies on heavy parameter communication, TP manages to shard parameters, gradients, optimizer states AND activations across devices without requiring any model parameter movement between GPUs. What! How is this even possible?! Let's explore this seemingly magical approach together! 🙂</p>
|
| 794 |
|
|
@@ -814,13 +816,13 @@
|
|
| 814 |
|
| 815 |
<p>In practice a small example of the operation looks like this:</p>
|
| 816 |
|
| 817 |
-
<p><img alt="image.png" src="/assets/images/
|
| 818 |
|
| 819 |
<p>Let’s see how we can parallelise this operation! In tensor parallelism, tensors will be split into N shards along a particular dimension and distributed across N GPUs. Matrices can be split either on the column part or row part leading to row and column parallelism. One thing we’ll see in the following is that choosing row or column sharding will require different communications primitives.</p>
|
| 820 |
|
| 821 |
<p>Our first option is to use column-wise sharding (also called <strong><em>column-linear</em></strong>): We'll copy the complete input matrices to each worker, requiring an operation called <strong><em>broadcast</em></strong>, and split the weight matrix into columns. The inputs are then multiplied with the partial weight matrices, and the results are finally combined using an <strong><em>all-gather</em></strong> operation.</p>
|
| 822 |
|
| 823 |
-
<p><img alt="image.png" src="/assets/images/
|
| 824 |
|
| 825 |
<p>Here's the code implementation of column wise tensor parallelism:</p>
|
| 826 |
|
|
@@ -837,7 +839,7 @@
|
|
| 837 |
|
| 838 |
<p>We see here our fourth distributed primitive: <strong><em>scatter</em></strong>!</p>
|
| 839 |
|
| 840 |
-
<p><img alt="image.png" src="/assets/images/
|
| 841 |
|
| 842 |
<p>Here's the implementation for row-wise tensor parallelism:</p>
|
| 843 |
|
|
@@ -858,7 +860,7 @@
|
|
| 858 |
|
| 859 |
<p>The Feedforward part can be parallelized by having a “Column linear” followed by a “Row Linear” which amounts to a broadcast to copy the input and an all-reduce in forward. Note that the broadcast isn’t needed in actual training where we can make sure inputs are already synced across TP ranks.</p>
|
| 860 |
|
| 861 |
-
<p><img alt="image.png" src="/assets/images/
|
| 862 |
|
| 863 |
<p>Now that we’ve found the most efficient schema for the Feedforward part of the transformer, let’s take a look at the multi-head attention block (MHA).</p>
|
| 864 |
|
|
@@ -866,17 +868,17 @@
|
|
| 866 |
|
| 867 |
<p>It's also worth noting that the tensor parallelism degree should not exceed the number of Q/K/V heads because we need intact heads per TP rank. And in case we’re using GQA, TP degree should be below number of K/V heads, otherwise it requires additional comms to keep them in sync. For instance, LLaMA-3 8B has 8 Key/Value heads, so the tensor parallelism degree should be less than or equal to 8, otherwise if TP=16 for example, we need to duplicate each K/V head and make sure they stay in sync.</p>
|
| 868 |
|
| 869 |
-
<p><img alt="image.png" src="/assets/images/
|
| 870 |
|
| 871 |
<p>Finally note that there is a tradeoff in terms of communication as we’ve added several distributed communication primitive directly in the computation path of our model. At the difference of ZeRO where we could prefetch, it can be harder to make these communication fully overlap with computations. </p>
|
| 872 |
|
| 873 |
-
<p><img alt="Forward pass in Tensor Parallelism" src="/assets/images/
|
| 874 |
|
| 875 |
<p>Looking at the timeline of operations in tensor-parallel MLP (same applies for Attention), we can better understand the tradeoffs involved. In the forward of each decoder layer, we hit a synchronization point with the AllReduce operation that cannot be overlapped with computation. This <em>exposed communication</em> overhead is necessary to combine partial results across tensor-parallel ranks before the final LayerNorm can be applied. </p>
|
| 876 |
|
| 877 |
<p>Tensor parallelism does help reduce activation memory for the matrix multiplications since the intermediate activations are sharded across GPUs. However, we still need to gather the full activations for operations like LayerNorm, which means we're not getting the full memory benefits we could. Additionally, it introduces significant communication requirements that heavily depend on the network infrastructure. The inability to hide this particular AllReduce behind computation means it directly adds to the critical path of forward propagation.</p>
|
| 878 |
|
| 879 |
-
<p><img alt="Impact of Tensor Parallelism on model performance and batch size capacity: while increasing TP leads to reduced per-GPU throughput (left), it enables processing of larger batch sizes (right), illustrating the trade-off between computational efficiency and memory availability in distributed training." src="/assets/images/
|
| 880 |
|
| 881 |
<p>Impact of Tensor Parallelism on model performance and batch size capacity: while increasing TP leads to reduced per-GPU throughput (left), it enables processing of larger batch sizes (right), illustrating the trade-off between computational efficiency and memory availability in distributed training.</p>
|
| 882 |
|
|
@@ -884,7 +886,7 @@
|
|
| 884 |
|
| 885 |
<p>However, tensor parallelism provides important benefits for memory usage by distributing model parameters, gradients, optimizer states and activations (to some extent) across GPUs. Let's examine this effect on a 70B parameter model:</p>
|
| 886 |
|
| 887 |
-
<p><img alt="
|
| 888 |
|
| 889 |
<p>As we can see, increasing tensor parallelism reduces the memory needed for model parameters, gradients and optimizer states on each GPU. While tensor parallelism does help reduce activation memory in attention and feedforward layers by sharding the matrix multiplications across GPUs, we don't get the full memory benefits we could. This is because operations like layer normalization and dropout still require gathering the full activations on each GPU, partially negating the memory savings. We can do better by finding ways to parallelize these remaining operations as well.</p>
|
| 890 |
|
|
@@ -924,7 +926,7 @@
|
|
| 924 |
|
| 925 |
<p><img alt=" in forward: f = no-op ; f* = all-reduce ; g = all-gather ; g* = reduce-scatter
|
| 926 |
in backward: f = all-reduce ; f* = no-op ; g = reduce-scatter ; g* = all-gather
|
| 927 |
-
SP region needs full hidden_dim" src="/assets/images/
|
| 928 |
|
| 929 |
<p>in forward: f = no-op ; f<em> = all-reduce ; g = all-gather ; g</em> = reduce-scatter in backward: f = all-reduce ; f<em> = no-op ; g = reduce-scatter ; g</em> = all-gather SP region needs full hidden_dim</p>
|
| 930 |
|
|
@@ -945,7 +947,7 @@
|
|
| 945 |
|
| 946 |
<p>For sequence parallelism (SP), we use different operations labeled "g" and "g*". Specifically, we avoid using all-reduce in the SP region since that would require gathering the full activations and increase our peak memory usage, defeating the purpose of SP.</p>
|
| 947 |
|
| 948 |
-
<p><img alt="image.png" src="/assets/images/
|
| 949 |
|
| 950 |
<p>So what is actually happening here? As a famous LLM would say, let’s take it step-by-step:</p>
|
| 951 |
|
|
@@ -1033,13 +1035,13 @@
|
|
| 1033 |
|
| 1034 |
<p>By using sequence parallelism, we can achieve even greater activation memory savings, allowing us to push our batch size and sequence length further than what would be possible with tensor parallelism alone. Let's see what that means for our previous 70B model example:</p>
|
| 1035 |
|
| 1036 |
-
<p><img alt="
|
| 1037 |
|
| 1038 |
<p>Does that mean that SP incurs more communication than TP? Well, yes and no. In the forward of a vanilla TP we had two all-reduce per transformer block, and in SP we have two all-gather and two reduce-scatter per transformer block. So SP does twice the number of communication operations as TP. But since an all-reduce operation can be broken down into to an all-gather + reduce-scatter (see in [TODO: Appendix link]) they’re actually equivalent in terms of communication. Same reasoning for backward as we just use the conjugate of each operation (no-op ↔ allreduce and allgather ↔ reducescatter).</p>
|
| 1039 |
|
| 1040 |
<p>If you’ve been paying close attention, you’ll notice that we’re talking about 4 comms ops in each layer (2 for Attention and 2 for MLP). This is how the MLP profiling looks like when using Tensor + Sequence Parallelism:</p>
|
| 1041 |
|
| 1042 |
-
<p><img alt="
|
| 1043 |
|
| 1044 |
<p>Besides the fact that TP requires communications in each layer, it also can’t easily be overlapped with compute, which makes throughput heavily dependent on the communication bandwidth. This is why TP is usually done only within a node (TP≤8).</p>
|
| 1045 |
|
|
@@ -1048,7 +1050,7 @@
|
|
| 1048 |
|
| 1049 |
<p>As you might expect, this communication overhead becomes increasingly problematic as we scale up tensor parallelism. To illustrate this, let’s check throughput as we scale TP with SP for a 3B model:</p>
|
| 1050 |
|
| 1051 |
-
<p><img alt="
|
| 1052 |
<p>Impact of combined Tensor and Sequence Parallelism (TP/SP) on a 3B model’s performance and memory utilization with 4096 seqlen: when scaling both TP and SP together, there's a trade-off between computational efficiency (left) and memory capacity (right). While higher parallelism degrees reduce per-GPU throughput, they enable processing of significantly larger batch sizes by reducing the activation memory.</p>
|
| 1053 |
|
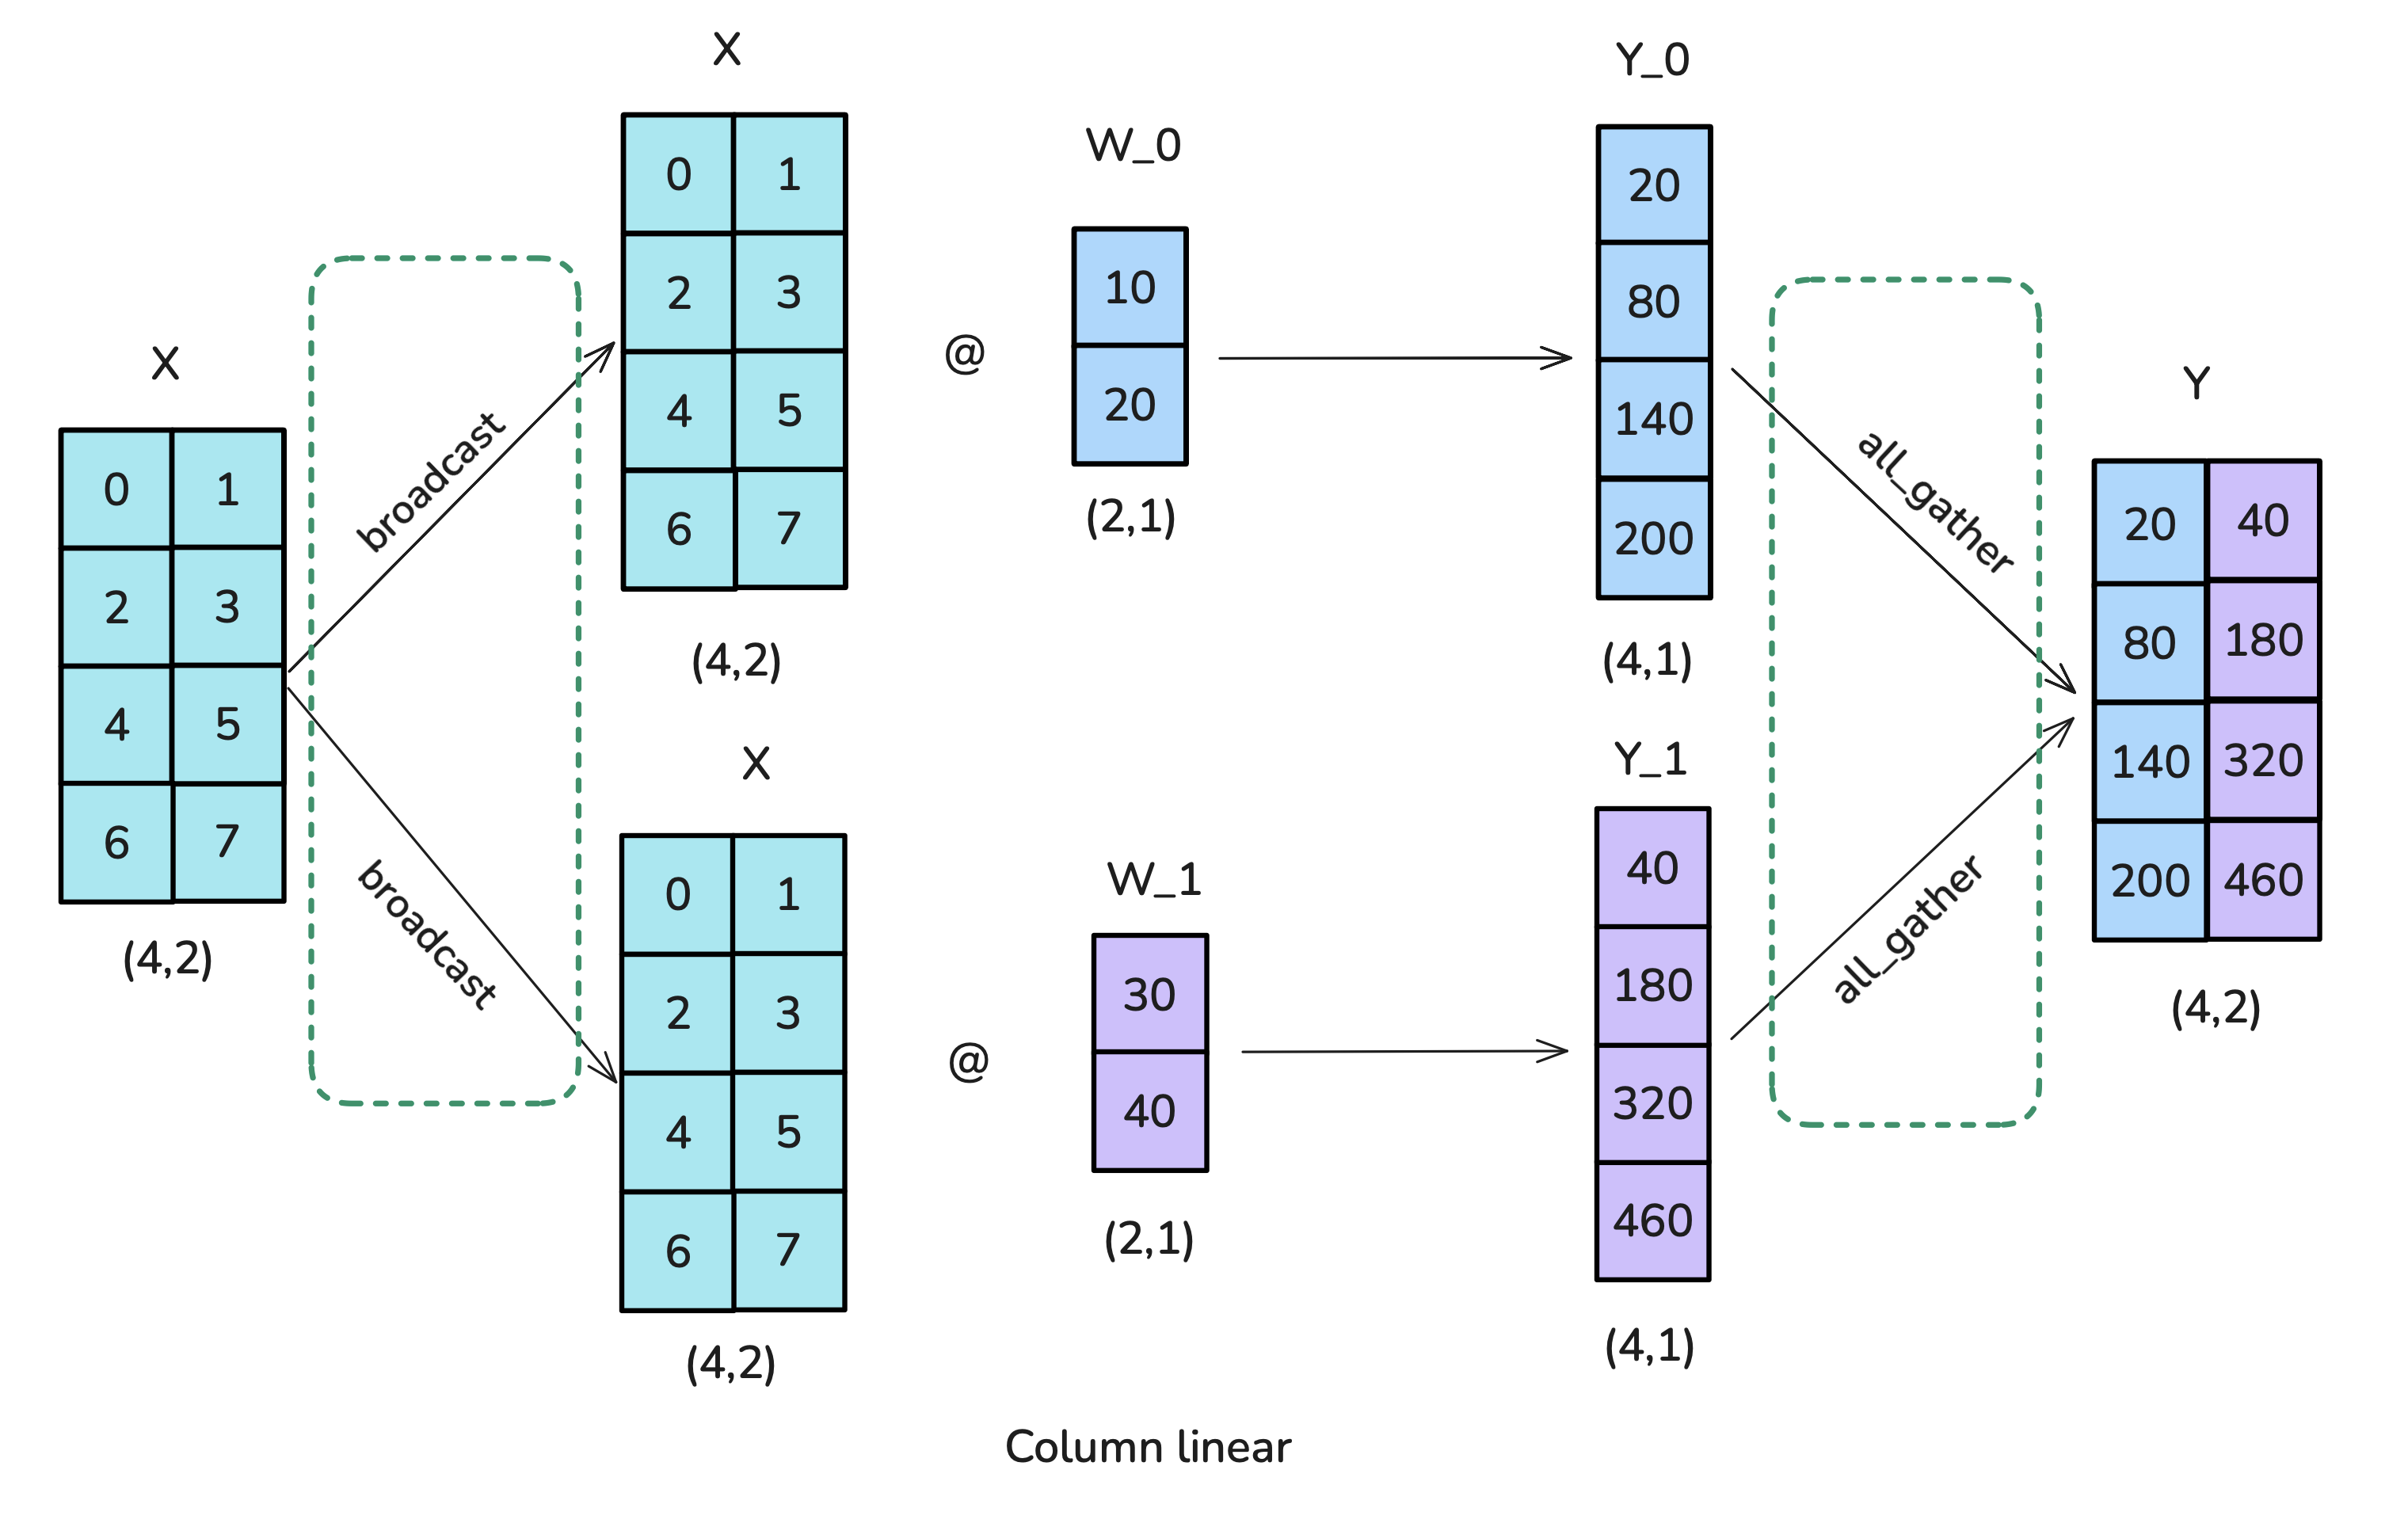
| 1054 |
<p>Let’s summarize our observations:</p>
|
|
@@ -1078,7 +1080,7 @@
|
|
| 1078 |
|
| 1079 |
<p>Even if we use full recomputation of the activations, which comes at a heavy compute overhead (30%), we still need to hold in memory some activations at the layer boundaries which scale linearly with sequence length:</p>
|
| 1080 |
|
| 1081 |
-
<p><img alt="image.png" src="/assets/images/
|
| 1082 |
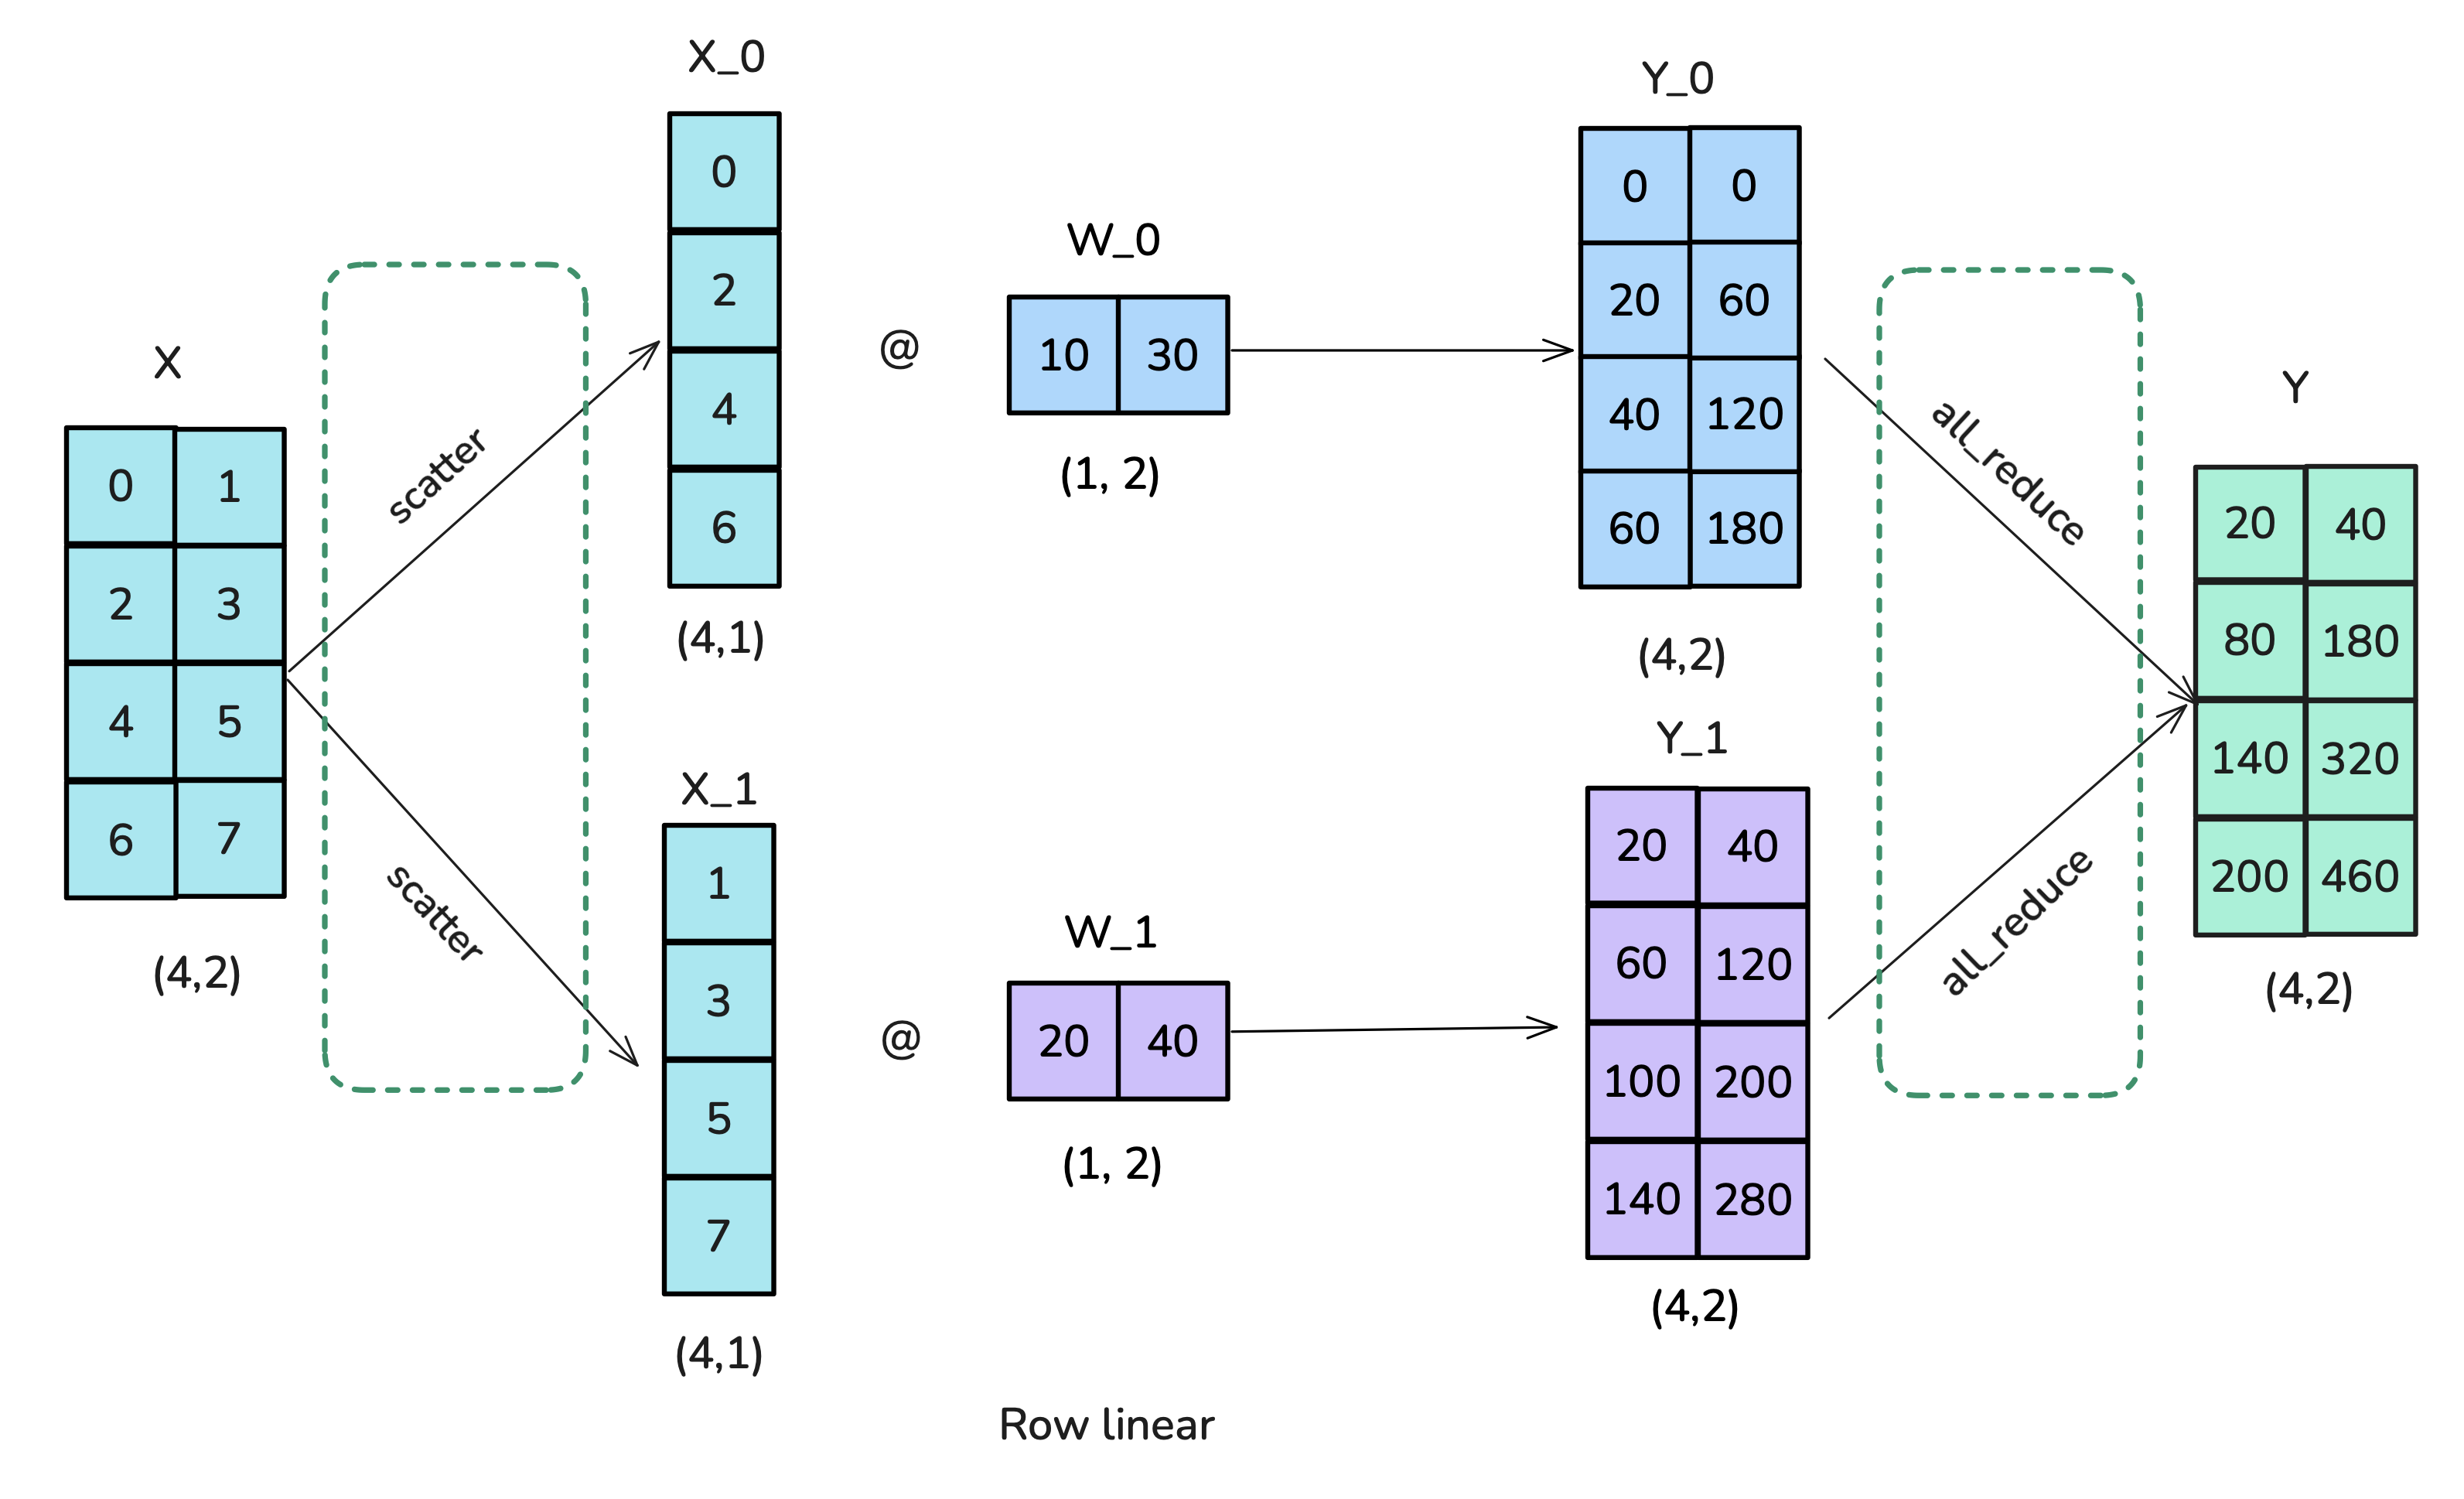
|
| 1083 |
<p>Can we apply similar ideas to our sequence parallelism approach but inside in the modules where we apply Tensor Parallelism already, thereby also reducing the effect of sequence length? Yes, it’s time to talk about Context Parallelism, which you will find quite intuitive after all we’ve already convered.</p>
|
| 1084 |
|
|
@@ -1086,7 +1088,7 @@
|
|
| 1086 |
|
| 1087 |
<p>The idea of Context Parallelism is quite simple; just like Sequence Parallelism, we’ll split the input along the sequence dimension but we now apply this splitting along the full model, instead of only the sequence parallel regions of the model as we’ve done previous with Tensor + Sequence Parallelism.</p>
|
| 1088 |
|
| 1089 |
-
<p><img alt="
|
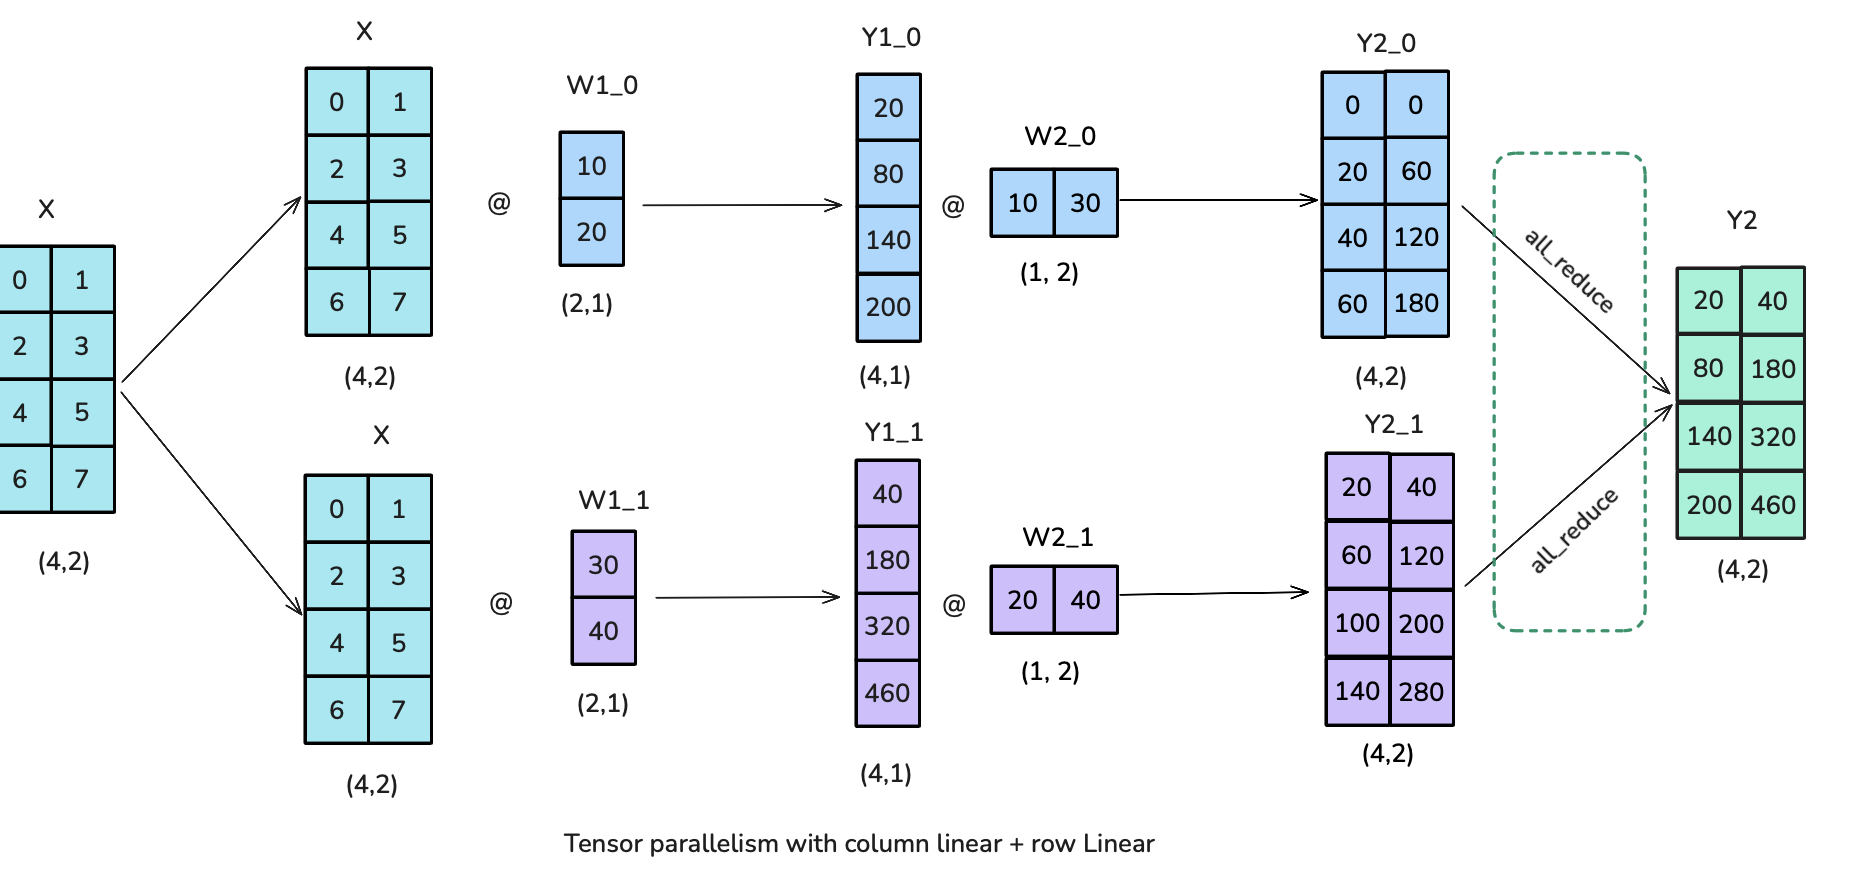
| 1090 |
|
| 1091 |
<p>Splitting the sequence doesn't affect most modules like MLP and LayerNorm, where each token is processed independently. It also doesn’t require expensive communication like TP, as only the inputs are split and not the weight matrices. Just like data parallelism, after computing the gradients, an all-reduce operation is initiated to synchronize the gradients across the context parallelism group.</p>
|
| 1092 |
|
|
@@ -1117,13 +1119,13 @@
|
|
| 1117 |
|
| 1118 |
<p>The whole process with 4 GPUs is shown in the following animation:</p>
|
| 1119 |
|
| 1120 |
-
<p><img alt="
|
| 1121 |
|
| 1122 |
<p>With this animation, it’s also immediately clear why the authors chose to call this approach Ring Attention.</p>
|
| 1123 |
|
| 1124 |
<p>There is one big problem though which is that a naive implementation of Ring Attention lead to some strong imbalance between GPU streaming from the shape of the causal attention matrix. Let’s take a real look at what is happening in the SoftMax computation by considering the attention score matrix with the causal attention mask:</p>
|
| 1125 |
|
| 1126 |
-
<p><img alt="
|
| 1127 |
|
| 1128 |
<p>The SoftMax is computed row-wise, which means whenever a GPU has received all the tokens of a row it can be computed. We see that GPU1 can immediately compute it as it starts with tokens 1-4 and GPU1 actually doesn’t need to receive any information from any other GPUs. However, GPU2 will need to wait for the second round to also receive 1-4 and thus have all values for tokens 1-8. Also, GPU1 seems to perform much less work than all the other GPUs.</p>
|
| 1129 |
|
|
@@ -1133,14 +1135,14 @@
|
|
| 1133 |
|
| 1134 |
<p>We need a better way to distribute the input sequences. This can be achieved by assigning the tokens not purely sequential to the GPUs but by mixing the ordering a bit such that we have a good mix of early and late tokens on each GPU. This approach is called Zig-Zag attention<d-cite bibtex-key="attention brandon2023fasterring"></d-cite> and in this new arrangement, the attention mask will show an even distribution of computation but if you count the number of colored squares, you’ll see that the computation is now balanced across all GPUs.</p>
|
| 1135 |
|
| 1136 |
-
<p><img alt="
|
| 1137 |
|
| 1138 |
<p>At the same time we’ll also see that in order to complete all rows, each GPU will need information from all the other GPUs.</p>
|
| 1139 |
|
| 1140 |
<p>We have two general ways to overlap computation and communication, either by performing a general all-gather, regrouping all the KV on each GPUs at the same time (in a Zero-3 type of way) or we gather them one-by-one from each GPU to each GPU as needed:</p>
|
| 1141 |
|
| 1142 |
-
<p><img alt="
|
| 1143 |
-
<p><img alt="
|
| 1144 |
|
| 1145 |
<p>The key difference between these two implementations lies in their communication patterns and memory usage:</p>
|
| 1146 |
|
|
@@ -1150,7 +1152,6 @@
|
|
| 1150 |
<li>All GPUs simultaneously gather the complete key/value pairs from all other GPUs</li>
|
| 1151 |
<li>Requires more temporary memory as each GPU needs to store the full KV pairs at once</li>
|
| 1152 |
<li>Communication happens in one step but with larger memory overhead</li>
|
| 1153 |
-
<li>Used in MegatronLM's implementation of context parallelism</li>
|
| 1154 |
</ul>
|
| 1155 |
|
| 1156 |
<p><strong>2. All-to-All (Ring) Implementation:</strong></p>
|
|
@@ -1159,7 +1160,6 @@
|
|
| 1159 |
<li>GPUs exchange KV pairs in a ring-like pattern, one chunk at a time</li>
|
| 1160 |
<li>More memory efficient as each GPU only needs to store one additional chunk temporarily</li>
|
| 1161 |
<li>Communication is spread out and overlapped with computation, though with some additional base latency overhead from multiple communication steps</li>
|
| 1162 |
-
<li>Used in DeepSpeed's implementation of context parallelism</li>
|
| 1163 |
</ul>
|
| 1164 |
|
| 1165 |
<p>The All-to-All approach generally offers better memory efficiency at the cost of slightly more complex communication patterns, while the AllGather approach is simpler but requires more temporary memory during the attention computation.</p>
|
|
@@ -1170,12 +1170,12 @@
|
|
| 1170 |
|
| 1171 |
<p>In the TP section we saw that if we try to scale Tensor parallelism past the number of GPUs per single node (typically 4 or 8) we hit a lower bandwidth network called “inter-node connection” which can quite strongly impair our performances. We can see this clearly on e.g. the all-reduce operation when we perform it across several nodes:</p>
|
| 1172 |
|
| 1173 |
-
<p><img alt="
|
| 1174 |
<p>Inter-node communication bandwidth measurements across different node counts, showing median (lines) and 5th-95th percentile ranges (shaded areas) for AllReduce, AllGather and ReduceScatter operations.</p>
|
| 1175 |
|
| 1176 |
<p>Sequence and context parallelism can help for long sequences but don’t help much if sequence length is not the root cause of our memory issues but rather the size of the model itself. For large model (70B+), the size of the weights alone can already push past the limits of the 4-8 GPUs on a single node. We can solve this issue by summoning the fourth (and last) parallelism dimension: “pipeline parallelism”.</p>
|
| 1177 |
|
| 1178 |
-
<p><img alt="
|
| 1179 |
|
| 1180 |
<p>Pipeline Parallelism is conceptually very simple –we’ll simply spread the layers of our model across GPUs – but the devil lies in implementing it efficiently. Let’s dive in it!</p>
|
| 1181 |
|
|
@@ -1189,7 +1189,7 @@
|
|
| 1189 |
|
| 1190 |
<p>Indeed reader! The main challenge in pipeline parallelism will be how to efficiently circumvent the sequential nature of PP to keep our GPU busy at all times and avoid having one GPU computing while the others are waiting. Here is how our GPU utilization is looking when doing a naive and simple forward and backward pass through the model where the numbers indicate the model layers:</p>
|
| 1191 |
|
| 1192 |
-
<p><img alt="image.png" src="/assets/images/
|
| 1193 |
<p>An example of Pipeline parallelism for a model with 16 layers distributed across 4 GPUs. The numbers correspond to the layer IDs.</p>
|
| 1194 |
|
| 1195 |
<p>The remaining idle time is indicated in grey and usually called the “bubble” and the sight of this probably break your heart after we spent so much time optimizing throughput.</p>
|
|
@@ -1208,7 +1208,7 @@
|
|
| 1208 |
|
| 1209 |
<p>Let’s take a first tool out of our toolbox and think about splitting our batch into smaller bit-sized portions which can be processed in parallel or almost, like we did before in data parallel for instance. Now when the second GPU is busy processing micro-batch 1, the first GPU can already start processing micro-batch 2. Here is a schedule using 8 micro-batches:</p>
|
| 1210 |
|
| 1211 |
-
<p><img alt="
|
| 1212 |
|
| 1213 |
<aside>Before the numbers in the diagram indicated the layers but in all pipeline parallel plots from now including this one it indicates a microbatch. You can think of each square here to contain several layers as seen in the previous figure. </aside>
|
| 1214 |
|
|
@@ -1241,11 +1241,12 @@
|
|
| 1241 |
|
| 1242 |
<p>This schedule is called <strong><em>one-forward-one-backward (1F1B)</em></strong> as the middle/steady state involves alternatively performing one forward and one backward pass. The general idea is to start performing the backward pass as soon as possible. The schedule looks like this:</p>
|
| 1243 |
|
| 1244 |
-
<p><img alt="image.png" src="/assets/images/
|
| 1245 |
|
| 1246 |
<p>The bubble still has the same size so our training efficiency is not significantly improved. However we only need to store activations for <d-math>p</d-math> micro-batches instead of <d-math>m</d-math> which quite reduce the activation memory explosion we had in the AFAB schedule. As a consequence we can add more microbatches which then will actually reduce the bubble.</p>
|
| 1247 |
|
| 1248 |
-
|
|
|
|
| 1249 |
|
| 1250 |
<p>A major complexity of this setup, visible on the above graph is how forward and backward passes are not cleanly consecutive anymore but performed in parallel across devices. This means we will have to schedule the switch from forward to backward passes independently on each device instead of in a simple and common central training loop as usual.</p>
|
| 1251 |
|
|
@@ -1276,7 +1277,7 @@
|
|
| 1276 |
|
| 1277 |
<p>This can be seen in general as a kind of “looping pipeline” where a micro-batch will move in circles from one GPU to the next as it goes through the forward pass through the model.</p>
|
| 1278 |
|
| 1279 |
-
<p><img alt="
|
| 1280 |
|
| 1281 |
<p>As a consequence we see additional communications happening as the model goes several times through each GPU for the same computation that previously just took one pass. However, each forward and backward pass is divided by a factor of <d-math>v</d-math>, where <d-math>v</d-math> is the number of stages or model chunks per GPUs as we are able to better interleave forward and backward passes. </p>
|
| 1282 |
|
|
@@ -1291,14 +1292,14 @@
|
|
| 1291 |
|
| 1292 |
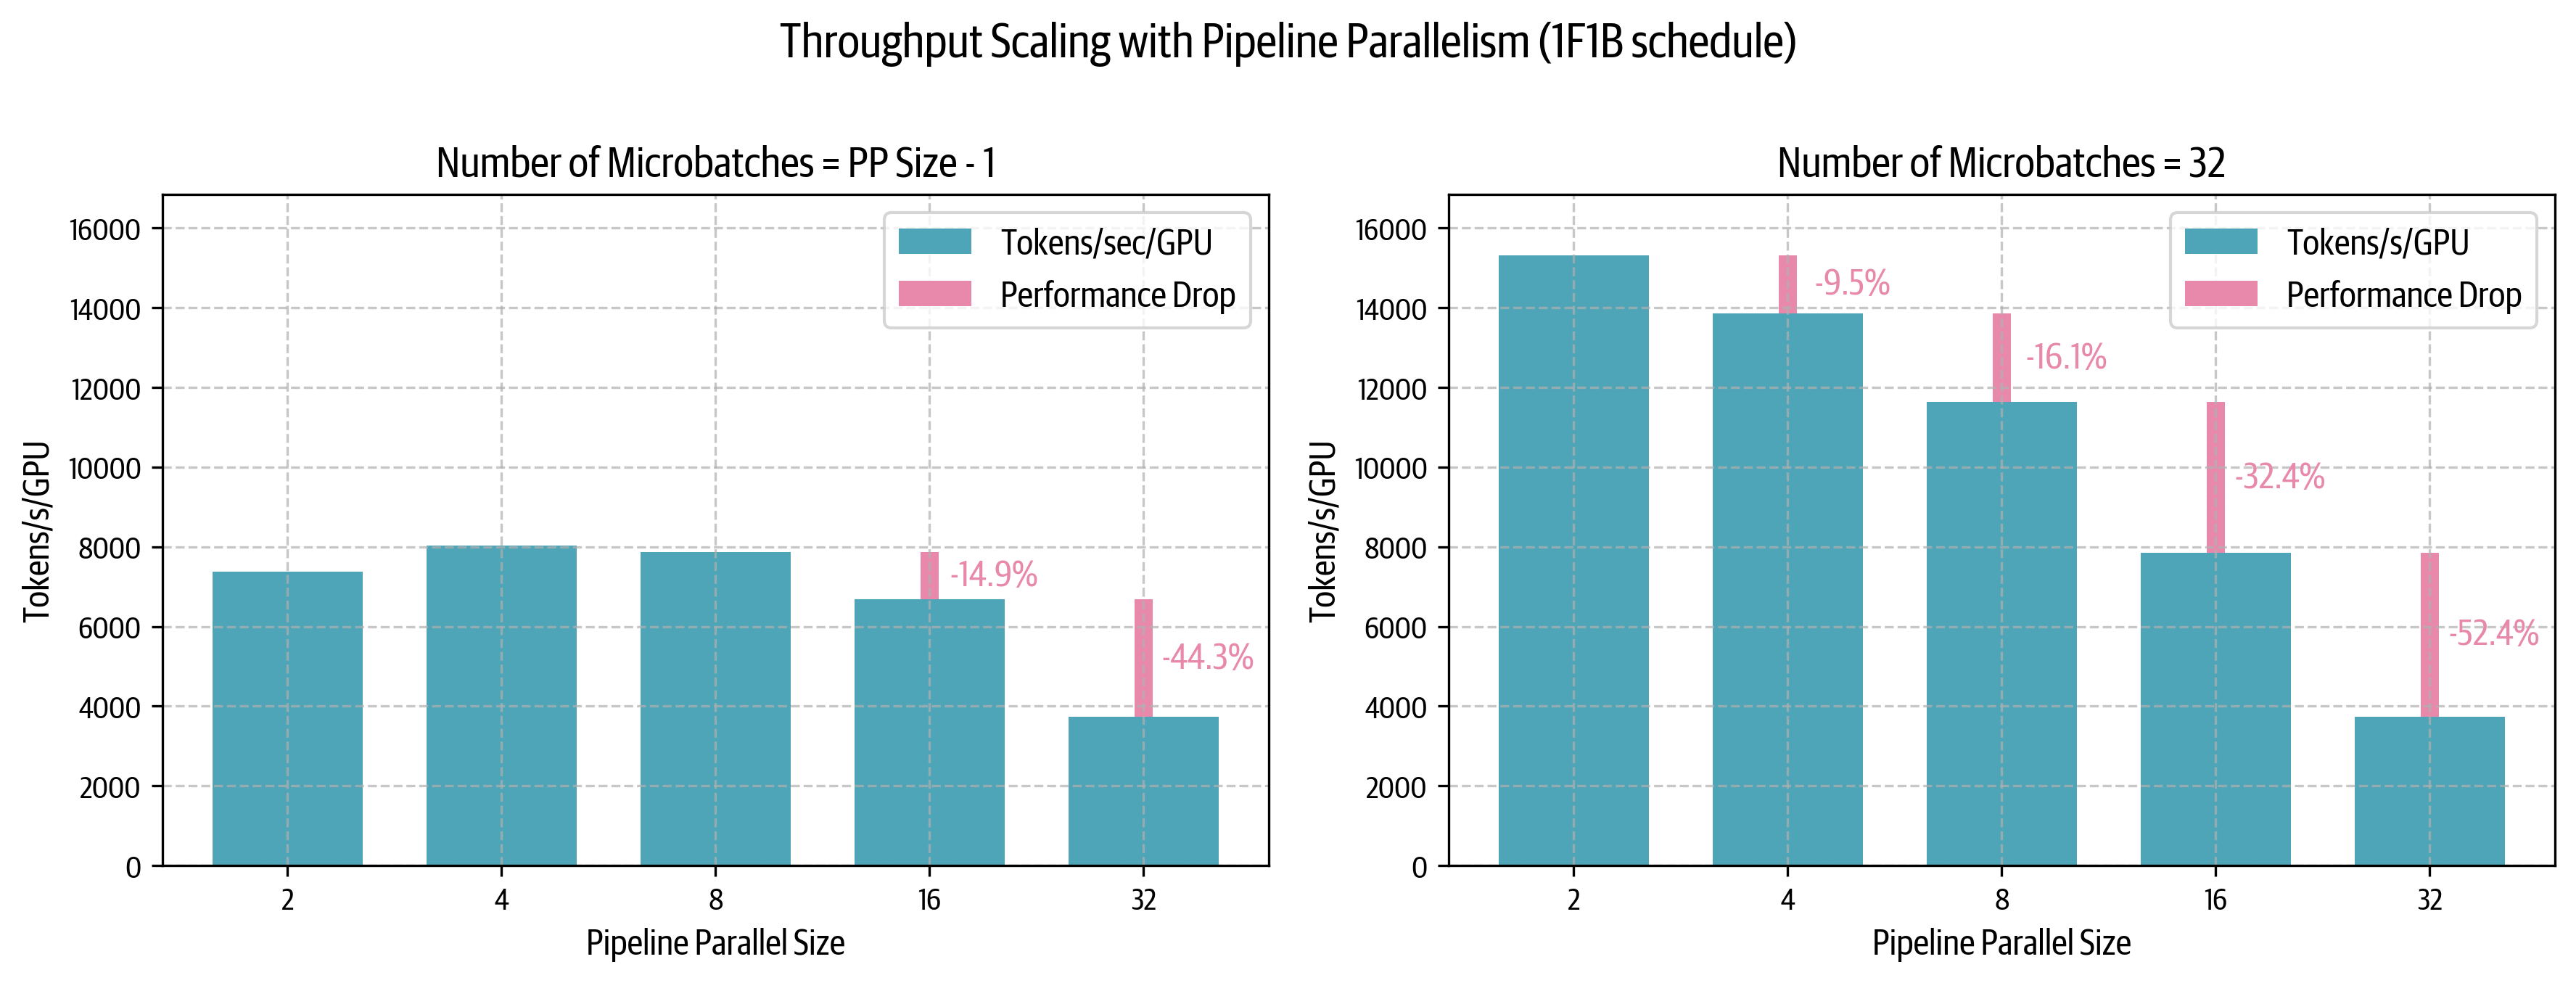
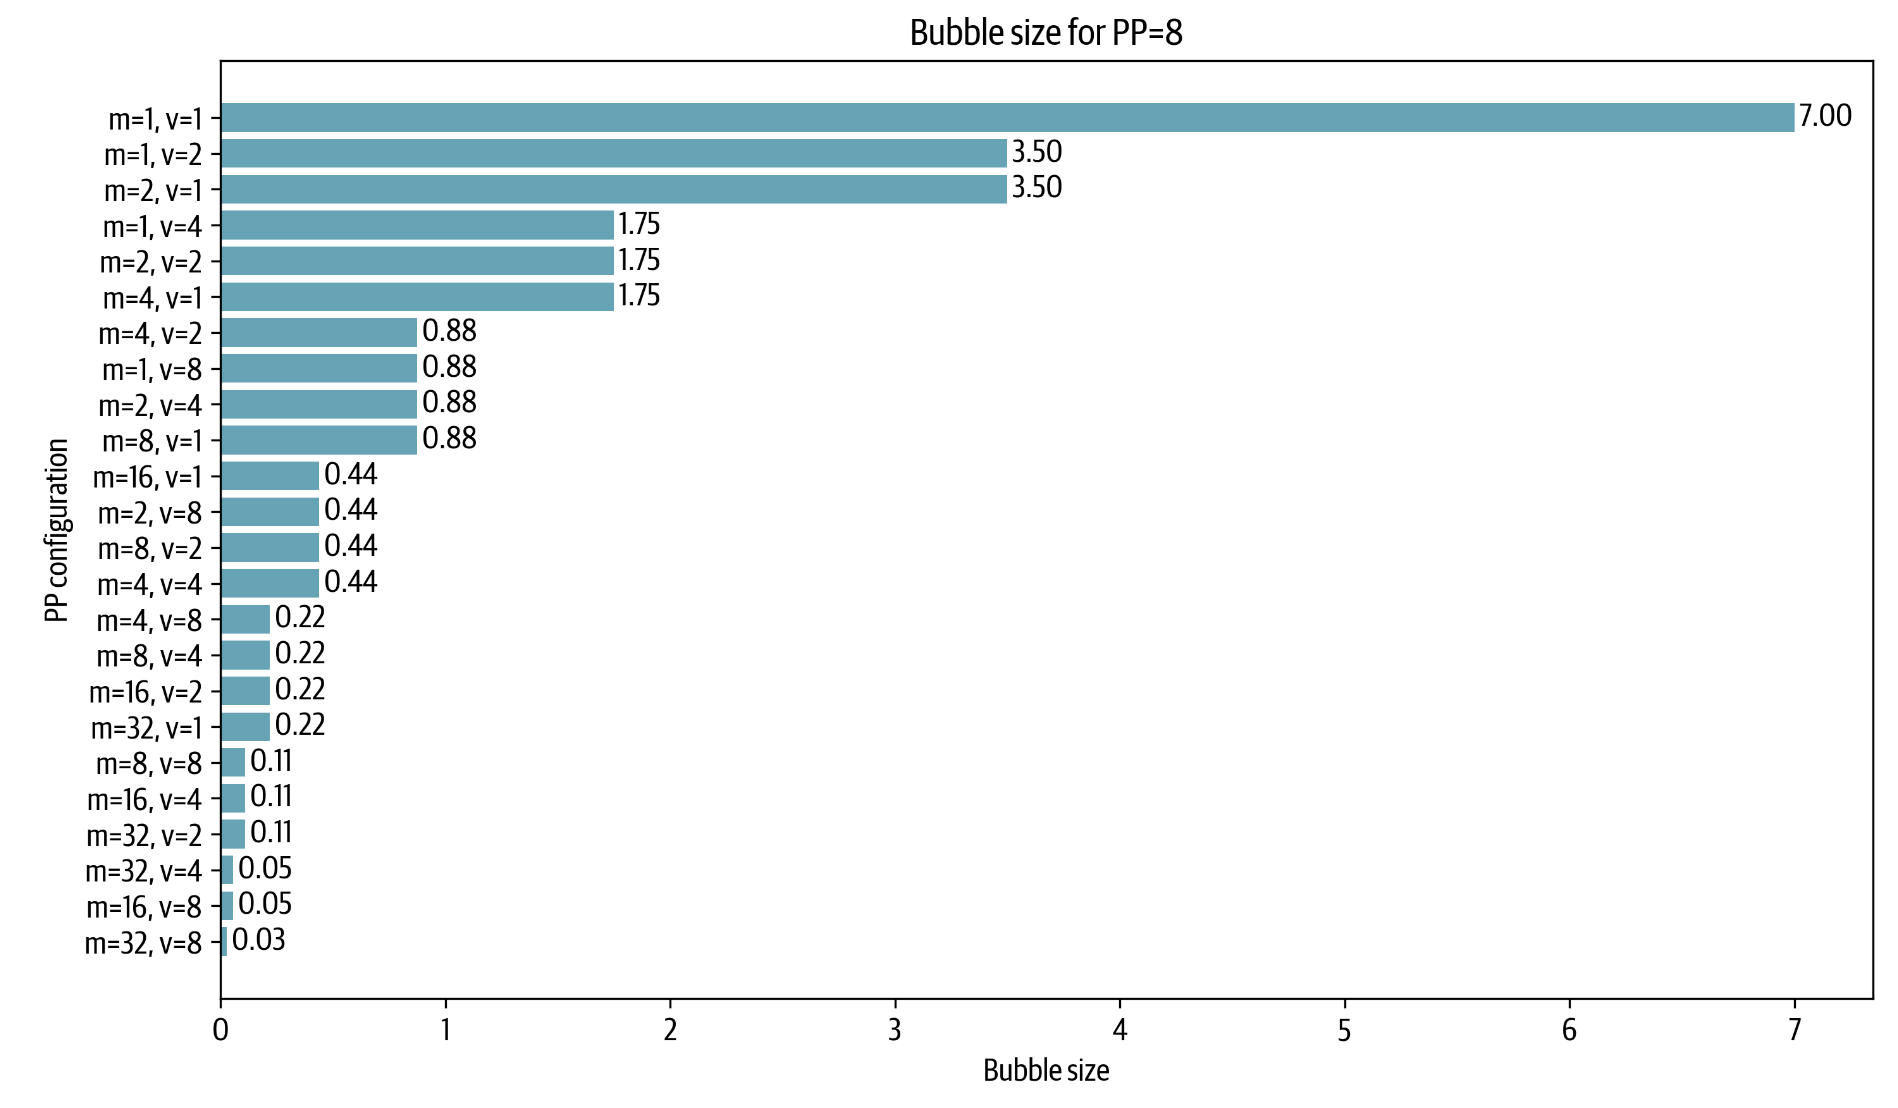
<p>So we can now decrease the bubble by adding microbatches and interleaved stages, but note that quantitatively, the amount of communication also increases by <d-math>v</d-math> so it’s a trade off. In the following plot you can see several configurations for a PP setup with <d-math>p=8</d-math>, where the special case of <d-math>m=1, v=1</d-math> corresponds to naive pipeline parallelism and the configurations with <d-math>v=1</d-math> are AFAB or 1F1B setups and <d-math>v \neq 1</d-math> are interleaved configurations.</p>
|
| 1293 |
|
| 1294 |
-
<p><img alt="
|
| 1295 |
|
| 1296 |
|
| 1297 |
<p>Scheduling also becomes more complex here as we need to decide on a GPU whether we are prioritizing at a given moment earlier micro-batches meaning that we close the forward and backward loops as fast as possible (so called “depth-first”, i.e. prioritizing getting batches out of the model as fast as possible) or we prioritize to first complete the forward passes of all microbatches in the queue before going over to backward passes (so called “breadth-first” i.e. prioritizing filling in the pipeline as much as possible). This is explained in detail in the "Breadth-Fist Pipeline" paper<d-cite bibtex-key="lamypoirier2023breadthfirstpipelineparallelism"></d-cite>.</p>
|
| 1298 |
|
| 1299 |
<p>You now have all the elements to understand the pipeline parallelism approach in Llama 3.1 which is using a one-forward-one-backward setup with interleaved stages and a priority setting tuneable between depth-first and bread-first.</p>
|
| 1300 |
|
| 1301 |
-
<p><img alt="
|
| 1302 |
|
| 1303 |
<p>However, we haven’t reached the end of possible pipeline schedules and recently some methods have been proposed to reduce the bubble to virtually zero! Peaked your curiosity? Let’s have a look!</p>
|
| 1304 |
|
|
@@ -1307,14 +1308,15 @@
|
|
| 1307 |
<p>There are even more sophisticated ways to reduce the bubble more and reached close to a “zero bubble” regime. The secret here is to split at an even finer-grained level the operations involved in order to interleave them in the most efficient way. For instance the pipeline implementation approach in DeepSeek V3/R1, called DualPipe reach close to a zero bubble regime.</p>
|
| 1308 |
|
| 1309 |
<p>Let’s very quickly see how this can work by detailing briefly the ZeroBubble<d-cite bibtex-key="qi2023zerobubblepipelineparallelism"></d-cite> work which is a precursor to DualPipe. The base observation of ZeroBubble is that a backward through a matrix multiplication involve actually two separated operations: backward for the inputs (B) and the backward for the weights (W):</p>
|
| 1310 |
-
|
| 1311 |
-
<p><img alt="image.png" src="/assets/images/
|
|
|
|
| 1312 |
|
| 1313 |
<p>While the output of B, the backward pass for the input, is necessary for performing the backward pass of the lower layers, the backward pass of the weights, W, is not necessary for the rest of the backward pass and generally only need to be performed before the optimiser step. This means W can be flexibly scheduled anywhere after the corresponding B of the same stage. This allows for strategic placement of W to fill the pipeline bubbles. The ZB-H2 schedule on the top right is an example of (theoretical) schedule with zero bubble taking advantage for this fine-grained decomposition.</p>
|
| 1314 |
|
| 1315 |
<p>DeepSeek’s DualPipe introduced with V3 proposes an extension of this decomposed approach to the case of two stream propagating from both sides of the PP ranks and being interleaved to minimize even further idle time in the GPUs are displayed in the following scheduling graph:</p>
|
| 1316 |
|
| 1317 |
-
<p><img alt="image.png" src="/assets/images/
|
| 1318 |
|
| 1319 |
<p>The ZeroBubble and DualPipe schedules are a bit too complex for us to give here code snippets but you should start to have a general idea of the concepts involved. In practice, optimizing these schedules requires careful measurements of the time for each operations followed by a scheduling algorithm able to find the most optimal allocation of time given the constrains. See for instance in the ZeroBubble paper<d-cite bibtex-key="qi2023zerobubblepipelineparallelism"></d-cite> for a discussion of the heuristics and algorithms to perform such a scheduling.</p>
|
| 1320 |
|
|
@@ -1325,7 +1327,7 @@
|
|
| 1325 |
|
| 1326 |
<p>Mixture-of-expert models have gained some traction with models such as Mixtral<d-cite bibtex-key="jiang2024mixtralexperts"></d-cite> or more recently DeepSeek-V3/R1! The basic idea is that instead of having a single feedforward module per layer we can have several and route tokens through different ones depending on their context:</p>
|
| 1327 |
|
| 1328 |
-
<p><img alt="
|
| 1329 |
<p>Source: A Survey on Mixture of Experts<d-cite bibtex-key="cai2024surveymixtureexperts"></d-cite> </p>
|
| 1330 |
|
| 1331 |
<p>This design makes it very easy to add a new parallelism paradigm: Expert parallelism (EP). Since the feedforward layers are fully independent we can simply put each expert’s feedforward layer on a different worker. Compared to TP it’s much more lightweight, since we don’t need to split the matrix multiplication, we just need to route the hidden states of a token to the right expert. There are several tricks to make EP work in practice, closely tied to model design. For instance, DeepSeek-V3 enforces a constraint in the router, ensuring that each token is sent to at most M nodes (in their case, 4) to reduce communication overhead.</p>
|
|
@@ -1458,7 +1460,7 @@
|
|
| 1458 |
|
| 1459 |
<p>And to have an idea of the memory benefits of each parallelism:</p>
|
| 1460 |
|
| 1461 |
-
<p><img alt="image.png" src="/assets/images/
|
| 1462 |
|
| 1463 |
<h2>How to Find the Best Training Configuration</h2>
|
| 1464 |
|
|
@@ -1617,12 +1619,12 @@
|
|
| 1617 |
|
| 1618 |
<p>On the compute side, GPUs consist of an array of compute units called <strong>Streaming Multiprocessors</strong> (SM). Each SM contains and controls a set of streaming processors, also known as cores. For example, an Nvidia H100 GPU has 132 SMs with 128 cores per SM, resulting in a total of 16,896 cores (see <a href="https://resources.nvidia.com/en-us-tensor-core">docs for tensor cores</a> for details), each capable of handling multiple threads simultaneously.</p>
|
| 1619 |
|
| 1620 |
-
<p><img alt="image.png" src="/assets/images/
|
| 1621 |
<p>TODO: Original figure from https://blog.codingconfessions.com/p/gpu-computing.</p>
|
| 1622 |
|
| 1623 |
<p>The memory side is also highly hierarchical with several layers of cache and memory: <strong>Registers</strong> are the smallest units and are private to the threads during executions, <strong>Shared Memory</strong> and <strong>L1 cache are</strong> shared between the threads running on a single SM, higher up is the <strong>L2 cache</strong> shared by all SMs, finally there is the <strong>Global Memory</strong> which is the largest memory on the GPU (the advertised 80 GB for a H100 for instance) but also the slowest to access and query.</p>
|
| 1624 |
|
| 1625 |
-
<p><img alt="image.png" src="/assets/images/
|
| 1626 |
<p>TODO: Original figure from https://www.youtube.com/watch?v=ZQKMZIP3Fzg</p>
|
| 1627 |
|
| 1628 |
<p>The goal of GPU will be to run as many workloads as possible, in parallel, on the GPU cores, by taking advantage of this hierarchical organization of compute/memory.</p>
|
|
@@ -1775,16 +1777,17 @@
|
|
| 1775 |
|
| 1776 |
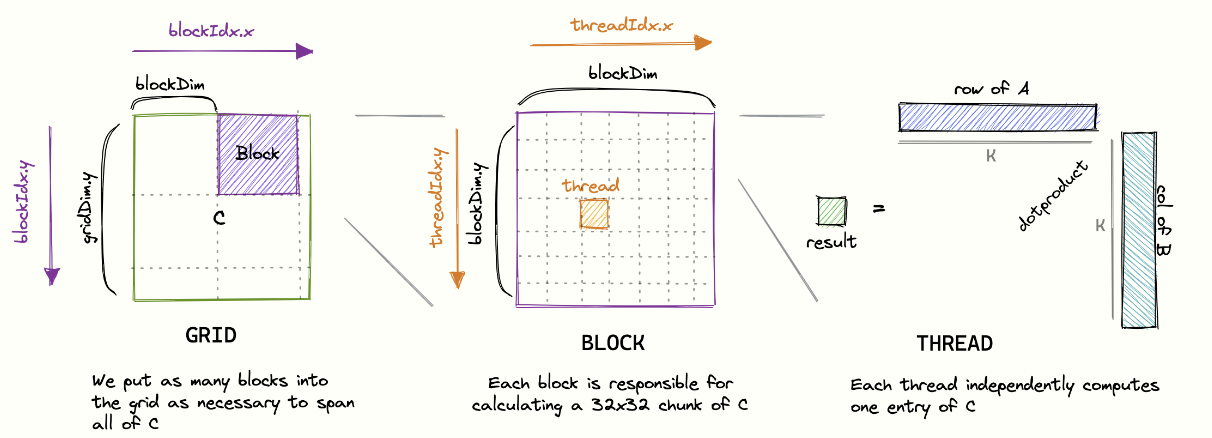
<p>Here’s an excellent visualization of the kernel from this <a href="https://siboehm.com/articles/22/CUDA-MMM">fantastic blogpost</a>: </p>
|
| 1777 |
|
| 1778 |
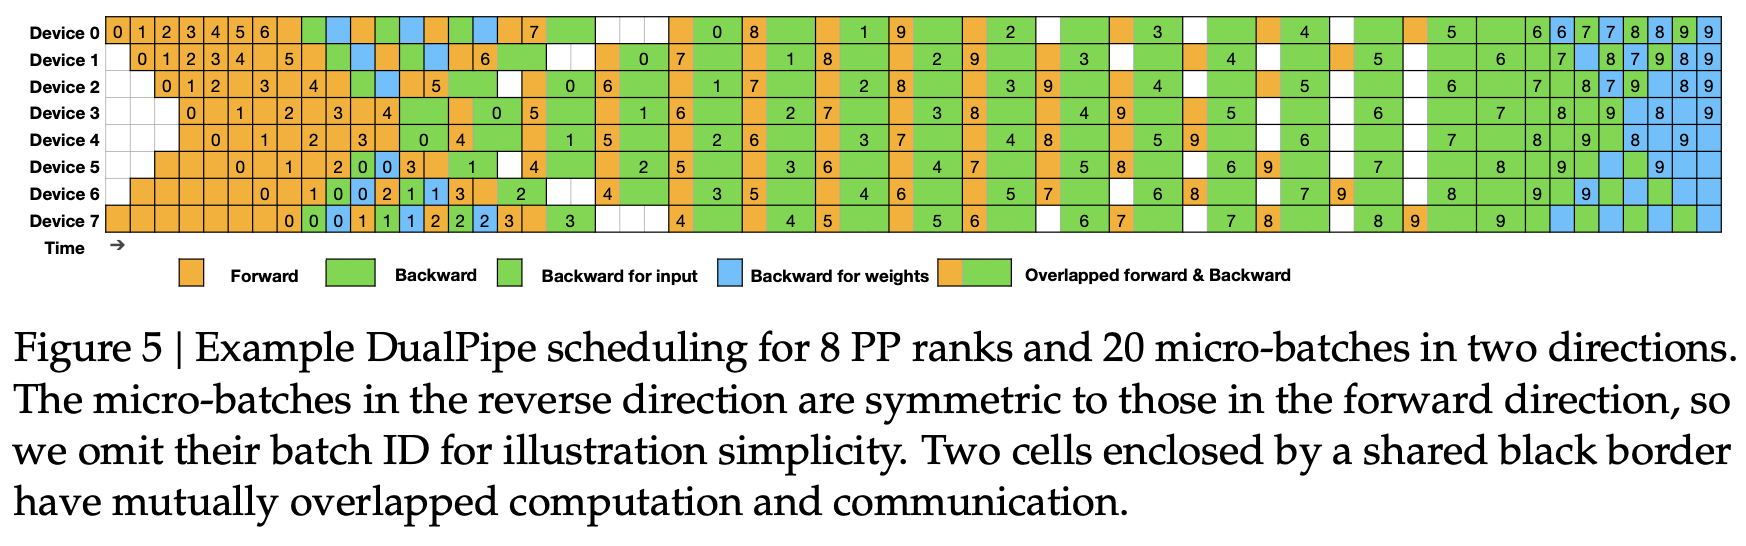
-
<p><img alt="image.png" src="/assets/images/
|
| 1779 |
|
| 1780 |
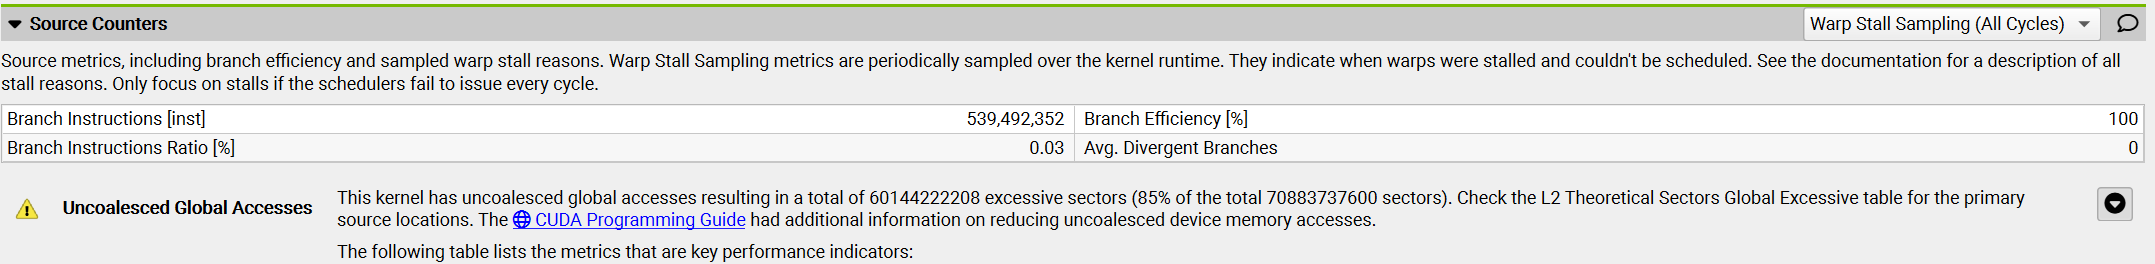
<p>However, when profiling this kernel with a tool like <code>ncu</code>, we can see issues, including low memory throughput and uncoalesced memory accesses.</p>
|
| 1781 |
|
| 1782 |
-
<p><img alt="image.png" src="/assets/images/
|
|
|
|
| 1783 |
|
| 1784 |
|
| 1785 |
<p>The reason for this is that in this kernel, two threads in the same block with Thread IDs <code>(0, 0)</code> and <code>(1, 0)</code> (which will end up in the same warp) will both load from the same column of matrix <code>B</code> but different rows of matrix <code>A</code>. Since matrix elements are stored in row-major order (meaning each row's elements are in consecutive memory addresses, as shown in the figure below), in the first iteration with <code>i = 0</code>, thread <code>(0, 0)</code> will load <d-math>A_{0,0}</d-math>, and thread <code>(1, 0)</code> will load <d-math>A_{1,0}</d-math>. These elements are not stored close to each other in memory, and this misalignment repeats across all iterations along the shared dimension, preventing memory accesses from being coalesced.</p>
|
| 1786 |
|
| 1787 |
-
<p><img alt="image.png" src="/assets/images/
|
| 1788 |
|
| 1789 |
|
| 1790 |
<p>To improve our kernel we can change the way the coordinates x and y are calculated like the following : </p>
|
|
@@ -1806,7 +1809,7 @@
|
|
| 1806 |
|
| 1807 |
<p>When we profile our new kernel, we notice that the warning about uncoalesced memory accesses has disappeared, and <strong>the GPU's memory throughput has increased by approximately 10 times</strong>.</p>
|
| 1808 |
|
| 1809 |
-
<p><img alt="image.png" src="/assets/images/
|
| 1810 |
|
| 1811 |
|
| 1812 |
<p>We also notice that the execution time of the kernel <strong>decreases by 10x</strong> !</p>
|
|
@@ -1822,7 +1825,7 @@
|
|
| 1822 |
|
| 1823 |
<p>In the tiling approach, each iteration involves all threads within a block cooperatively loading two tiles—one from matrix A and another from matrix B —into shared memory. Specifically, threads load a tile of matrix A (of size <code>BLOCK_SIZE_M</code> by <code>BLOCK_SIZE_K</code>) and a tile of matrix B (of size <code>BLOCK_SIZE_K</code> by <code>BLOCK_SIZE_N</code>). Once the tiles are in shared memory, the threads perform matrix multiplication on these tiles, enabling efficient computation since all necessary data is quickly accessible. The results of the tile multiplication are stored in an accumulation matrix that holds intermediate results. After each iteration, the results from the current tile multiplication are added to this accumulation matrix, continuing until all tiles from both matrices have been processed.</p>
|
| 1824 |
|
| 1825 |
-
<p><img alt="image.png" src="/assets/images/
|
| 1826 |
<p>From https://cnugteren.github.io/tutorial/pages/page4.html</p>
|
| 1827 |
|
| 1828 |
<p>The important parts to understand the implementation are below (for simplicity we consider a square shaped tile) : </p>
|
|
@@ -1867,7 +1870,7 @@
|
|
| 1867 |
|
| 1868 |
<p>The tiling technique has significantly improved the performance of our kernel. However, when analyzing the warp states which quantify how many cycles were spent in each state, we observe the following:</p>
|
| 1869 |
|
| 1870 |
-
<p><img alt="image.png" src="/assets/images/
|
| 1871 |
|
| 1872 |
|
| 1873 |
<p>The meaning of the states can be found in the <a href="https://docs.nvidia.com/nsight-compute/ProfilingGuide/index.html#metrics-reference">Profiling Guide</a>, specifically in the <strong>Warp Stall Reasons</strong> section. There we can read that:</p>
|
|
@@ -1889,11 +1892,16 @@
|
|
| 1889 |
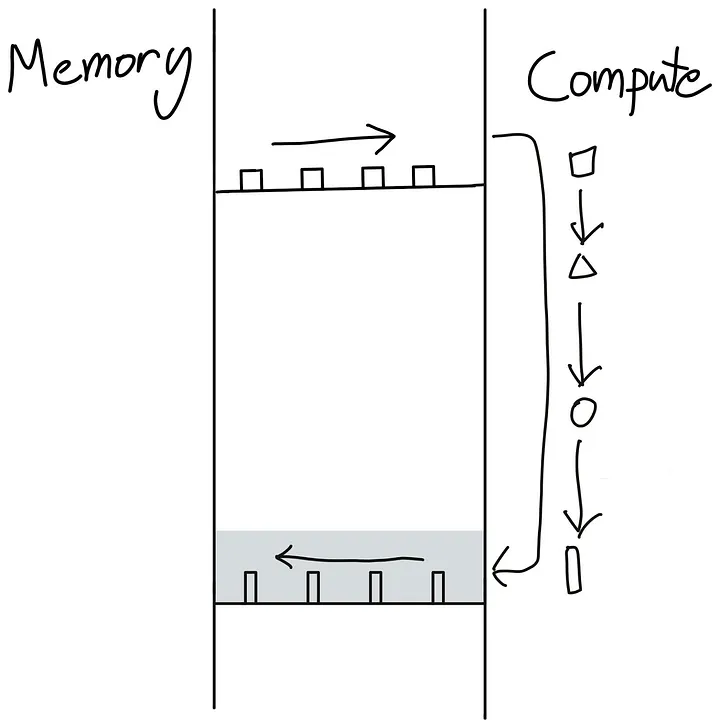
<p>In several places now we’ve mentioned how GPU and CPU operation can be asynchronous. In particular, the host code on the CPU can schedule workload on the GPU in a non-blocking way.</p>
|
| 1890 |
|
| 1891 |
<p>Non-blocking can be useful for overlapping communication and computation as we saw at several part along this blog post but can be extended to the more general idea of trying to avoid at all cost going back and forth between host and GPU kernel commands. This is beautifully illustrated by <a href="https://horace.io/brrr_intro.html">Horace He</a> in these diagrams:</p>
|
| 1892 |
-
|
| 1893 |
-
|
| 1894 |
-
|
| 1895 |
-
|
| 1896 |
-
|
|
|
|
|
|
|
|
|
|
|
|
|
|
|
|
| 1897 |
|
| 1898 |
<p>How can we avoid this back and forth? Well the best way is to make our GPU as autonomous as possible. This is achieved by packing as many successive compute operations together in a single kernel for the GPU to run, called a “Fused Kernel”.</p>
|
| 1899 |
|
|
@@ -1910,13 +1918,13 @@
|
|
| 1910 |
|
| 1911 |
<p>A basic implementation of the attention mechanism involve a lot of transfer between memory and workers. It requires materializing the S and P matrices in HBM which means that the results need to be sent to HBM and then back to SRAM for the next computations:</p>
|
| 1912 |
|
| 1913 |
-
<p><img alt="image.png" src="/assets/images/
|
| 1914 |
|
| 1915 |
<p>Since bandwidth is much lower in HBM this introduces a severe bottleneck in the attention computation. Can we do better? Tri Dao says yes!</p>
|
| 1916 |
|
| 1917 |
<p>The key element is to compute the S matrices in small pieces which can fit in the smaller shared memory of the SM. But we can do even better and avoid materializing the very large S matrix all together in favor of keeping only the necessary statistics for computing the normalization factor of the softmax. So we can compute part of <d-math>O</d-math> directly in one computation in SRAM rather than moving intermediate results back and forth. In this case, not even do we make use of the shared memory but we also release the memory bottleneck resulting from materializing one of the largest activation matrices in the model (at long context length), the attention matrix.</p>
|
| 1918 |
|
| 1919 |
-
<p><img alt="image.png" src="/assets/images/
|
| 1920 |
<p>From the FLASH-ATTENTION paper<d-cite bibtex-key="dao2022flashattention"></d-cite></p>
|
| 1921 |
|
| 1922 |
<p>The idea of flash attention resolves so many bottlenecks in model training that it has quickly become the default way to perform attention in all transformers:</p>
|
|
@@ -2002,14 +2010,14 @@
|
|
| 2002 |
|
| 2003 |
<p>Reducing the total number of bits comes at a price (no free lunch here either), but we have some control over how to pay. Either we can sacrifice more bits on the mantissa or exponent. For this reason there exist also two float8 formats, named according to exponent and mantissa, to flexibly choose the most appropriate format. We can look at the possible range of numbers for each format:</p>
|
| 2004 |
|
| 2005 |
-
<p><img alt="image.png" src="/assets/images/
|
| 2006 |
|
| 2007 |
|
| 2008 |
<p>We can see that float32 spans 80 orders of magnitude and float16 sacrifices a lot of range while bfloat16 maintains the full range. The two float8 formats reduce the range even further where e5e2 can maintain float16 range and e4m3 has an even smaller ranger.</p>
|
| 2009 |
|
| 2010 |
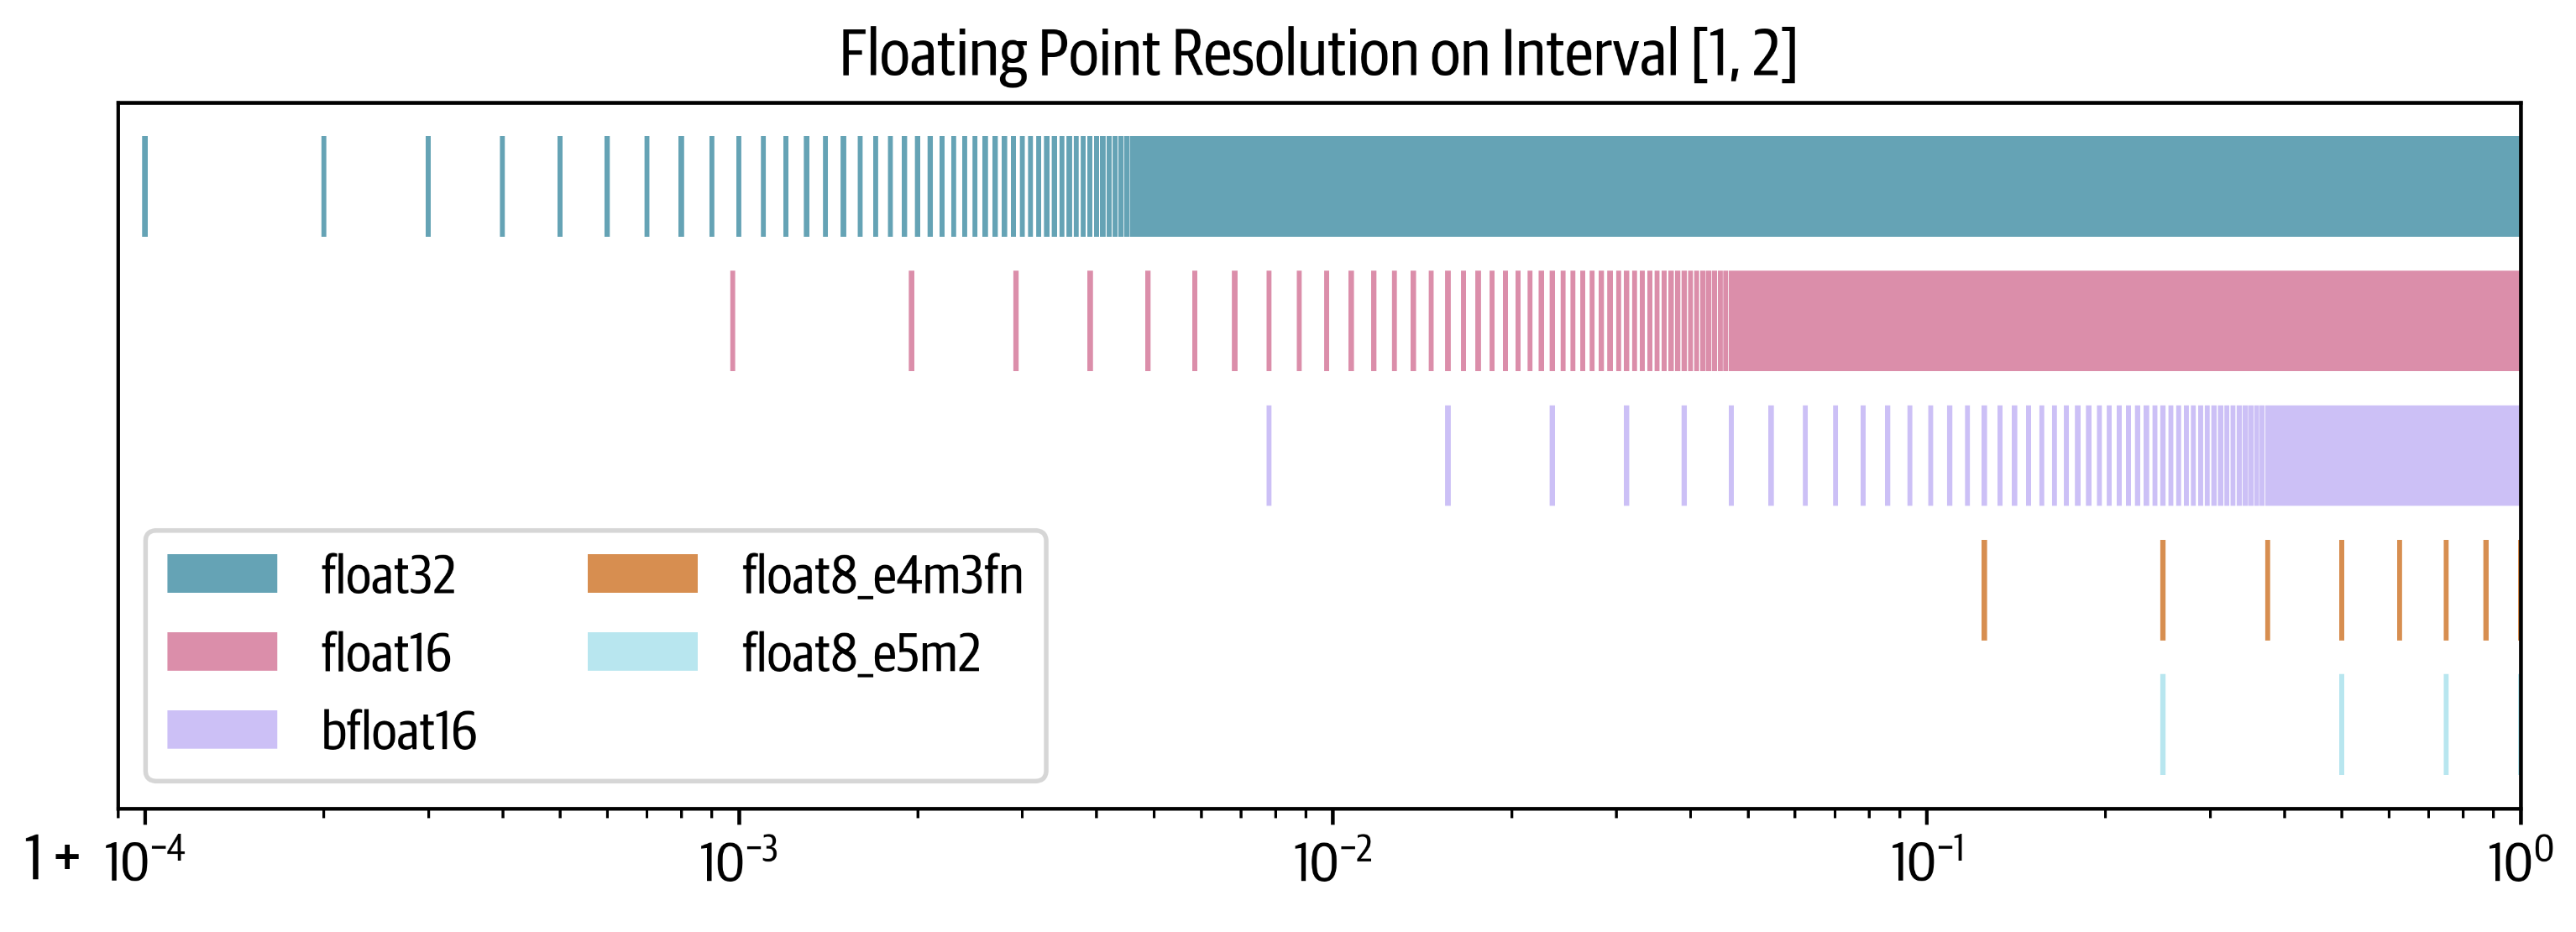
<p>How come some format are able to maintain the range and other not? Let’s investigate the resolution by plotting 10,000 points between 1 and 2. Each point will be rounded to the nearest representable number in each format:</p>
|
| 2011 |
|
| 2012 |
-
<p><img alt="image.png" src="/assets/images/
|
| 2013 |
|
| 2014 |
<p>We can see here that bfloat16 maintained the range of float32 over float16 but did this with the cost of sacrificing more precision. In case of float8 the situation is even more dire as e4m3 can represent 7 and e5m2 only 3 number on the interval 1-2.</p>
|
| 2015 |
|
|
@@ -2047,7 +2055,7 @@
|
|
| 2047 |
|
| 2048 |
<p>The first, successful, very large scale training with FP8 mixed precision was publicly reported on DeepSeek-V3. The authors carefully analyzed each operation of the forward pass (Fprop) as well as the activation (Dgrad) and weight (Wgrad) backward pass. Similar to BF16 mixed precision training, some aggregation and master weights are kept in higher precision while the operations themselves are performed in FP8. </p>
|
| 2049 |
|
| 2050 |
-
<p><img alt="image.png" src="/assets/images/
|
| 2051 |
|
| 2052 |
<p>In order to switch from high precision (e.g. FP32 or BF16) to lower precision (e.g. FP16 or FP8) with smaller range, we need to normalize the range of values by computing the absolute maximum. DeepSeek-V3 also introduces a quantization scheme, where the ranges are normalized per tile: 1x128 for inputs/activations and 128x128 for weights and scale elements. This makes the normalization less susceptible to outliers. There is a number of additional tricks they deploy to also reduce the memory and communication footprint which you can follow in section 3.3. of the DeepSeek-V3 technical report<d-cite bibtex-key="deepseekai2024deepseekv3technicalreport"></d-cite>. </p>
|
| 2053 |
|
|
@@ -2141,7 +2149,7 @@
|
|
| 2141 |
|
| 2142 |
<p>Congratulations! You've completed quite a journey - from understanding how to train a simple model on a single GPU, all the way to mastering the complex techniques used to efficiently train massive language models like Llama-405B and DeepSeek-V3. By now, you should feel confident interpreting advanced parallelism diagrams like the one below, which would have seemed daunting when you first started.</p>
|
| 2143 |
|
| 2144 |
-
<p><img alt="image.png" src="/assets/images/
|
| 2145 |
|
| 2146 |
<p>In distributed training, many concepts sound easy enough when you first hear them, like “Pipeline parallelism just distributes layers on different GPUs”, but we also worked through all the challenging details when implementing those methods. </p>
|
| 2147 |
|
|
@@ -2191,12 +2199,14 @@
|
|
| 2191 |
|
| 2192 |
<p>First, let's examine this heatmap visualization:</p>
|
| 2193 |
|
| 2194 |
-
<p><img alt="image.png" src="/assets/images/
|
| 2195 |
<p>Heatmap visualization showing the optimal training configurations across different model sizes and compute node counts. For each combination, the configuration details include Data Parallelism (DP), Tensor Parallelism (TP), Pipeline Parallelism (PP), Gradient Accumulation Steps (GAS), Micro Batch Size (MBS), and ZeRO optimization stage. The color intensity indicates the Model FLOPs Utilization (MFU), with brighter colors representing higher efficiency.</p>
|
| 2196 |
|
| 2197 |
<p>To complement this, let's look at the relationships between different parameters:</p>
|
| 2198 |
|
| 2199 |
-
<p><img alt="image.png" src="/assets/images/
|
|
|
|
|
|
|
| 2200 |
<p>Parallel coordinates plot showing the relationship between different model parallelism configurations (Data Parallel degree, Tensor Parallel degree, Pipeline Parallel degree), training hyperparameters (gradient accumulation steps, micro batch size), ZeRO stage and the resulting Model FLOPs Utilization (MFU). Each line represents a different training configuration, with colors indicating the MFU value - warmer colors show higher efficiency.</p>
|
| 2201 |
|
| 2202 |
<p>From these visualizations, we can draw several important insights:
|
|
|
|
| 415 |
|
| 416 |
<p>An interesting observation here is how the memory is not static for a given model but it scales linearly with both the sequence length and batch size. This means the activation memory is the part which will blow up when we increase our batch size or train with longer sequences. We can use this equation to look at how memory usage changes for various sequence lengths for example for Llama models (<code>bs=1</code>):</p>
|
| 417 |
|
| 418 |
+
<p><img alt="memusage_activations.svg" src="/assets/images/memusage_activations.svg" /></p>
|
| 419 |
|
| 420 |
<p>This graph tells a striking story: for short sequences (or similar for small batch-sizes), activations are almost negligible, but starting at around 2-4k tokens they come to take a significant amount of memory while parameter, gradient and optimizer states usage (that we’ll discuss later) stays roughly independent of the sequence length and batch size.</p>
|
| 421 |
|
|
|
|
| 429 |
|
| 430 |
<p>The general idea behind <strong><em>activation recomputation</em></strong> – also called <em>gradient checkpointing</em> or <em>rematerialization</em> – is to discard some activations during the forward pass to save memory and spend some extra compute to recompute these on the fly during the backward pass. Without recomputation, we store every hidden state between two learnable operations (e.g. FF, LayerNorm etc.), such that we can use them during the backward pass to compute gradients. When we use recomputation we typically will only store activations at a few key points along the model architecture, discard the rest of activations and recompute them on the fly during the backward pass from the nearest saved activations, basically performing again a sub-part of the forward pass to trade of memory for compute. It generally looks like this:</p>
|
| 431 |
|
| 432 |
+
<p><img alt="image.png" src="/assets/images/activation_recomputation.png" /></p>
|
| 433 |
|
| 434 |
<p>There are several strategies to select key activations to store:</p>
|
| 435 |
|
|
|
|
| 489 |
|
| 490 |
<p>Gradient accumulation allows us to effectively increase our batch size up to infinity (and beyond!) while the memory footprint stays constant. Gradient accumulation is also compatible with activation recomputation for further memory reduction. One drawback however, is that gradient accumulation requires multiple consecutive forward/backward passes per optimization step thereby increasing the compute overhead and slowing down training. No free lunch! </p>
|
| 491 |
|
| 492 |
+
<p><img alt="image.png" src="/assets/images/gradaccumulation_diag.png" /></p>
|
| 493 |
|
| 494 |
<aside>Using gradient accumulation means we need to keep buffers where we accumulate gradients which persist throughout a training step. Whereas without gradient accumulation, in the backward gradients are computed while freeing the activations memory, which means a lower peak memory.</aside>
|
| 495 |
|
|
|
|
| 508 |
|
| 509 |
<p>Using a different micro batch for each GPU means we’ll have different gradients in each GPU, so to keep the model instances in sync across different GPUs, the gradients from the model instances are averaged using an operation called “all-reduce”, which happens during the backward pass, before the optimizer step.</p>
|
| 510 |
|
| 511 |
+
<p><img alt="image.png" src="/assets/images/dp_diagram.png" /></p>
|
| 512 |
|
| 513 |
<aside>If you are not familiar with distributed communications patterns like broadcast, gather or all-reduce we put together a small crash course in the Appendix [TODO Link].</aside>
|
| 514 |
|
| 515 |
<p>This involves our first “distributed communication” primitive: <em><strong>all-reduce</em></strong> which handles the synchronization and communication between GPU instances and nodes.</p>
|
| 516 |
|
| 517 |
+
<p><img alt="image.png" src="/assets/images/dp_overlap1.svg" /></p>
|
| 518 |
|
| 519 |
<p>A naive DP implementation would just wait for the backward pass the finish so that we have all gradients, then it triggers an all-reduce over all DP ranks, to sync these gradients. But such an sequential steps of computation followed by communication is <strong>A BIG NO!</strong> Because we don’t want our GPUs to stay idle while communication is happening.</p>
|
| 520 |
|
|
|
|
| 540 |
if p.requires_grad is True:
|
| 541 |
p.register_post_accumulate_grad_hook(hook)</d-code>
|
| 542 |
|
| 543 |
+
<p><img alt="image.png" src="/assets/images/dp_overlap2.svg"/></p>
|
| 544 |
|
| 545 |
<p>Overlapping computation and communication reduces the time spent waiting for gradient synchronization across the entire model. Gradient synchronization can occur (at least partially) in parallel with backward pass, significantly speeding up data parallelism. Here's a full implementation of naive DP with synchronization overlap:</p>
|
| 546 |
|
|
|
|
| 574 |
</div>
|
| 575 |
</details>
|
| 576 |
|
| 577 |
+
<p><img alt="dp_overlap3.svg" src="/assets/images/dp_overlap3.svg" /></p>
|
| 578 |
|
| 579 |
<h4><strong>Third optimization: </strong>Interplay with gradient accumulation</h4>
|
| 580 |
|
|
|
|
| 634 |
|
| 635 |
<p>While data parallelism cleverly overlaps the all-reduce gradient synchronization with backward computation to save time, this benefit starts to break down at large scales. As we add more and more GPUs (hundreds or thousands), the overhead of coordinating between them grows significantly. The end result? We get less and less efficient returns from each additional GPU we add to the system:</p>
|
| 636 |
|
| 637 |
+
<p><img alt="image.png" src="/assets/images/dp_scaling.svg"/></p>
|
| 638 |
|
| 639 |
<p>As expected, we can also see that the memory usage per GPU is not affected by adding more DP ranks for training.</p>
|
| 640 |
|
|
|
|
| 642 |
|
| 643 |
<p>The keen reader has already probably noted however that this assumes that we can fit at least one input sample forward pass (mbs<em>=1)</em> into our GPU memory. This is not always the case! As we can see, larger models don’t fit into a single GPU, even with activation recomputation activated: </p>
|
| 644 |
|
| 645 |
+
<p><img alt="dp_ourjourney_memoryusage.svg" src="/assets/images/dp_ourjourney_memoryusage.svg" /></p>
|
| 646 |
|
| 647 |
<aside>Tip: you can quickly eyeball the minimal memory required for your model’s parameters by multiplying by 2 e.g. 70B → 140GB (=133GiB)</aside>
|
| 648 |
|
|
|
|
| 688 |
|
| 689 |
<p>The idea of ZeRO is to shard these objects across the DP ranks, each node only storing a slice of the items which are reconstructed when and if needed, thereby dividing memory usage by the data parallel degree <d-math>N_d</d-math>:</p>
|
| 690 |
|
| 691 |
+
<p><img alt="zero_memory.svg" src="/assets/images/zero_memory.svg" /></p>
|
| 692 |
<p>Memory consumption of DP and three stages of Zero-DP. <d-math>\Psi</d-math> denotes number of parameters, <d-math>k</d-math> denotes the memory multiplier of optimizer states (<d-math>k=12</d-math> for Adam), and <d-math>N_d</d-math> denotes DP degree.</p>
|
| 693 |
|
| 694 |
|
|
|
|
| 714 |
|
| 715 |
<p>See the figure below for all the necessary steps in one forward/backward pass cycle:</p>
|
| 716 |
|
| 717 |
+
<p><img alt="dp_zero1.gif" src="/assets/images/dp_zero1.gif" /></p>
|
| 718 |
|
| 719 |
<p>So in practice, compared to vanilla DP, Zero-1 adds an all-gather over all parameters after the optimizer step as we can see below:</p>
|
| 720 |
|
| 721 |
+
<p><img alt="dp_zero1_overlap.svg" src="/assets/images/dp_zero1_overlap.svg" /></p>
|
| 722 |
|
| 723 |
<p>If you've been following along, you'll recall from vanilla DP that we can overlap the all-reduce gradient communication with the backward pass computation. In ZeRO-1, we can also investigate how to efficiently overlap the newly added all-gather of bf16 parameters. There are two main strategies for this:</p>
|
| 724 |
|
|
|
|
| 742 |
|
| 743 |
<aside>In case of FP32 gradient accumulation, we only need to keep <d-math>\frac{1}{N_d}</d-math> fp32_grads where we accumulate the bf16 grads coming from the reduce-scatter. And in the optimizer step we use the <d-math>\frac{1}{N_d}</d-math> fp32_grads.</aside>
|
| 744 |
|
| 745 |
+
<p><img alt="dp_zero2.gif" src="/assets/images/dp_zero2.gif" /></p>
|
| 746 |
|
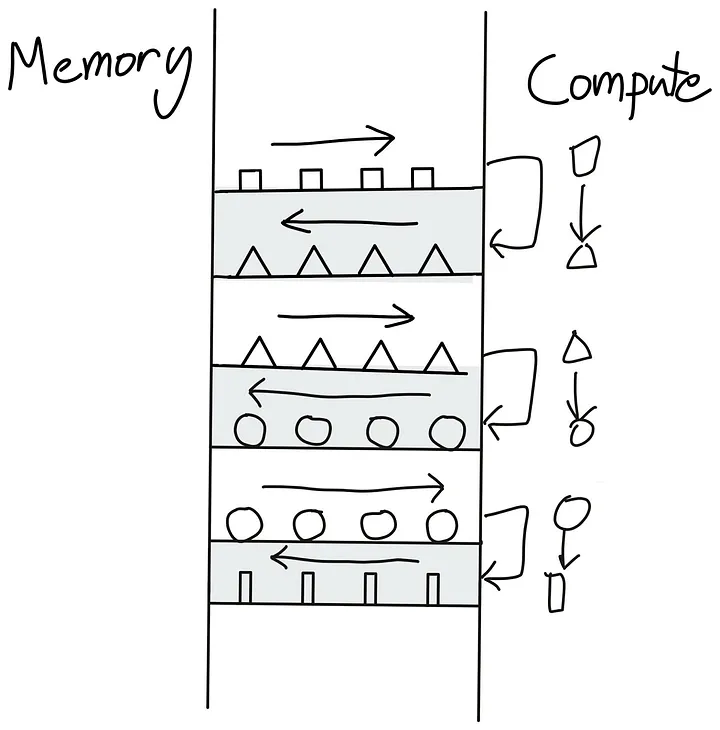
| 747 |
<p>It’s easy to see now that sharding the gradients leads to to <d-math>2\Psi + \frac{2\Psi+k\Psi}{N_d}</d-math> and as <d-math>N_d</d-math> is increased we can save up to 8x memory over the baseline. In terms of communication the same process applies as for ZeRO-1, with the only difference that we communicate and release on the fly. In total, ZeRO-2 is thus also equivalent to vanilla DP training w.r.t. communication.</p>
|
| 748 |
|
| 749 |
<p>In terms of communication ZeRO-2 is similar to ZeRO-1, they both require a reduce-scatter for the gradients, and an all-gather over all parameters.</p>
|
| 750 |
|
| 751 |
+
<p><img alt="dp_zero2_overlap.svg" src="/assets/images/dp_zero2_overlap.svg" /></p>
|
| 752 |
|
| 753 |
<aside>Note: You might notice that there is no real overhead of using ZeRO-2 over ZeRO-1 and indeed ZeRO-2 is usually the best option.</aside>
|
| 754 |
|
|
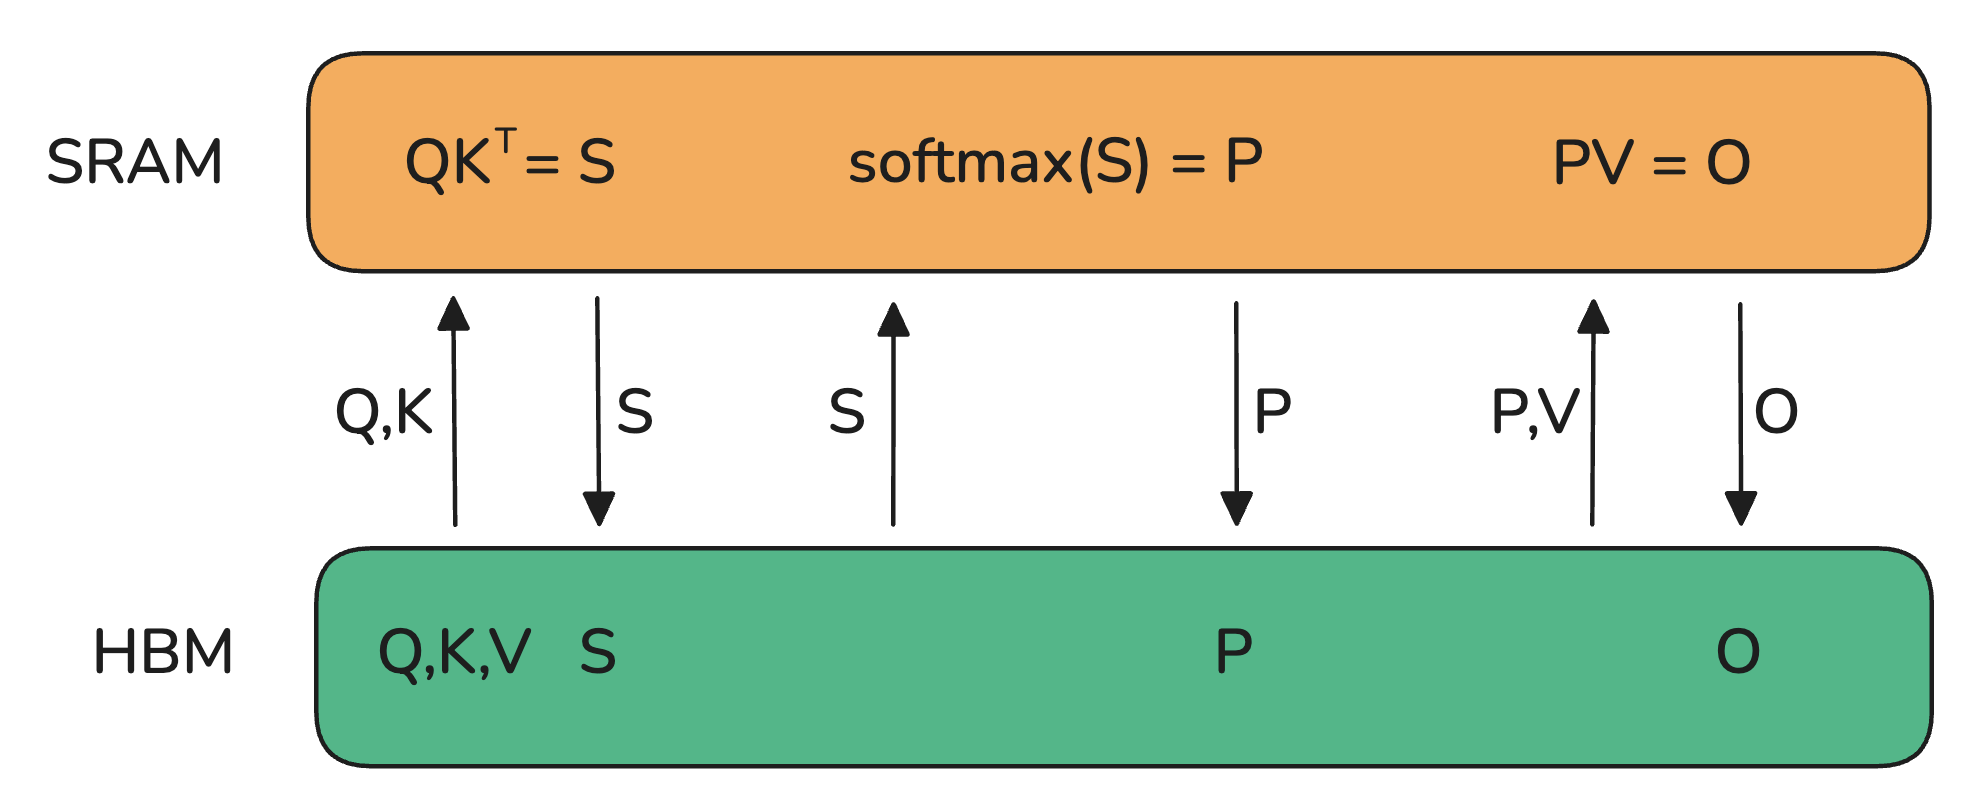
|
|
| 767 |
|
| 768 |
<p>So how do we do a forward or backward pass in practice if all parts of the model are distributed? Quite simply we gather them on-demand when we need them. In the forward pass this looks as follows:</p>
|
| 769 |
|
| 770 |
+
<p><img alt="dp_zero3_fwd.svg" src="/assets/images/dp_zero3_fwd.svg" /></p>
|
| 771 |
|
| 772 |
+
<p>So as we perform the forward pass and sequentially go through the layers we retrieve the necessary parameters on demand and immediately flush them from memory when we don't need them anymore. The backward pass works the same way just inverted in flow and we produce the gradient shards: </p>
|
| 773 |
|
| 774 |
+
<p><img alt="dp_zero3_bwd.svg" src="/assets/images/dp_zero3_bwd.svg" /></p>
|
| 775 |
|
| 776 |
+
<p>The other issue is that we need to do these all-gathers continuously throughout the forward and backward step, which amounts to <d-math>2\cdot \text{num\_layers} -1</d-math> additional all-gathers in <strong>a training step</strong> compared to Zero-2, each comes with a small <strong>base latency</strong> overhead as we can see in the following figure:</p>
|
| 777 |
+
|
| 778 |
+
<p><img alt="dp_zero3_overlap.svg" src="/assets/images/dp_zero3_overlap.svg" /></p>
|
| 779 |
|
| 780 |
<p>During the forward pass we do all-gather operations for the parameters when we need them, so a <d-math>\Psi</d-math> communication tax. Since we discard the parameters immediately after we needed them in the forward pass we need one more all-gather during the backward pass as well incurring another <d-math>\Psi</d-math> in communication tax. Finally we need the same <strong><em>reduce-scatter</em></strong> as in ZeRO-2 for the gradients which costs also <d-math>\Psi</d-math> in communication and we arrive at a total communication cost of <d-math>3\Psi</d-math>, compared to <d-math>2\Psi</d-math> for Zero-2.</p>
|
| 781 |
|
|
|
|
| 790 |
|
| 791 |
<p>However, there is a limit here, DP only works if a layer of the model fits in a single GPU and ZeRO can only partition the parameters, gradients, and optimizer states, but not the activation memory! Recall from the activation memory discussion that it scales with sequence length and batch size. Naturally we could just limit those, but in practice we don’t want to be limited by hardware to train with only with a short sequence length. </p>
|
| 792 |
|
| 793 |
+
<p><img alt="zero3_memoryusage.svg" src="/assets/images/zero3_memoryusage.svg" /></p>
|
| 794 |
|
| 795 |
<p>Now that we've efficiently used the DP axis to reduce memory through efficient communication patterns, let's explore a new, orthogonal axis of parallelism - Tensor Parallelism. Unlike ZeRO3 that relies on heavy parameter communication, TP manages to shard parameters, gradients, optimizer states AND activations across devices without requiring any model parameter movement between GPUs. What! How is this even possible?! Let's explore this seemingly magical approach together! 🙂</p>
|
| 796 |
|
|
|
|
| 816 |
|
| 817 |
<p>In practice a small example of the operation looks like this:</p>
|
| 818 |
|
| 819 |
+
<p><img alt="image.png" src="/assets/images/tp_diagram.png" /></p>
|
| 820 |
|
| 821 |
<p>Let’s see how we can parallelise this operation! In tensor parallelism, tensors will be split into N shards along a particular dimension and distributed across N GPUs. Matrices can be split either on the column part or row part leading to row and column parallelism. One thing we’ll see in the following is that choosing row or column sharding will require different communications primitives.</p>
|
| 822 |
|
| 823 |
<p>Our first option is to use column-wise sharding (also called <strong><em>column-linear</em></strong>): We'll copy the complete input matrices to each worker, requiring an operation called <strong><em>broadcast</em></strong>, and split the weight matrix into columns. The inputs are then multiplied with the partial weight matrices, and the results are finally combined using an <strong><em>all-gather</em></strong> operation.</p>
|
| 824 |
|
| 825 |
+
<p><img alt="image.png" src="/assets/images/tp_diagram2.png" /></p>
|
| 826 |
|
| 827 |
<p>Here's the code implementation of column wise tensor parallelism:</p>
|
| 828 |
|
|
|
|
| 839 |
|
| 840 |
<p>We see here our fourth distributed primitive: <strong><em>scatter</em></strong>!</p>
|
| 841 |
|
| 842 |
+
<p><img alt="image.png" src="/assets/images/tp_diagram3.png" /></p>
|
| 843 |
|
| 844 |
<p>Here's the implementation for row-wise tensor parallelism:</p>
|
| 845 |
|
|
|
|
| 860 |
|
| 861 |
<p>The Feedforward part can be parallelized by having a “Column linear” followed by a “Row Linear” which amounts to a broadcast to copy the input and an all-reduce in forward. Note that the broadcast isn’t needed in actual training where we can make sure inputs are already synced across TP ranks.</p>
|
| 862 |
|
| 863 |
+
<p><img alt="image.png" src="/assets/images/tp_diagram4.png" /></p>
|
| 864 |
|
| 865 |
<p>Now that we’ve found the most efficient schema for the Feedforward part of the transformer, let’s take a look at the multi-head attention block (MHA).</p>
|
| 866 |
|
|
|
|
| 868 |
|
| 869 |
<p>It's also worth noting that the tensor parallelism degree should not exceed the number of Q/K/V heads because we need intact heads per TP rank. And in case we’re using GQA, TP degree should be below number of K/V heads, otherwise it requires additional comms to keep them in sync. For instance, LLaMA-3 8B has 8 Key/Value heads, so the tensor parallelism degree should be less than or equal to 8, otherwise if TP=16 for example, we need to duplicate each K/V head and make sure they stay in sync.</p>
|
| 870 |
|
| 871 |
+
<p><img alt="image.png" src="/assets/images/tp_full_diagram.png" /></p>
|
| 872 |
|
| 873 |
<p>Finally note that there is a tradeoff in terms of communication as we’ve added several distributed communication primitive directly in the computation path of our model. At the difference of ZeRO where we could prefetch, it can be harder to make these communication fully overlap with computations. </p>
|
| 874 |
|
| 875 |
+
<p><img alt="Forward pass in Tensor Parallelism" src="/assets/images/tp_overlap.svg" /></p>
|
| 876 |
|
| 877 |
<p>Looking at the timeline of operations in tensor-parallel MLP (same applies for Attention), we can better understand the tradeoffs involved. In the forward of each decoder layer, we hit a synchronization point with the AllReduce operation that cannot be overlapped with computation. This <em>exposed communication</em> overhead is necessary to combine partial results across tensor-parallel ranks before the final LayerNorm can be applied. </p>
|
| 878 |
|
| 879 |
<p>Tensor parallelism does help reduce activation memory for the matrix multiplications since the intermediate activations are sharded across GPUs. However, we still need to gather the full activations for operations like LayerNorm, which means we're not getting the full memory benefits we could. Additionally, it introduces significant communication requirements that heavily depend on the network infrastructure. The inability to hide this particular AllReduce behind computation means it directly adds to the critical path of forward propagation.</p>
|
| 880 |
|
| 881 |
+
<p><img alt="Impact of Tensor Parallelism on model performance and batch size capacity: while increasing TP leads to reduced per-GPU throughput (left), it enables processing of larger batch sizes (right), illustrating the trade-off between computational efficiency and memory availability in distributed training." src="/assets/images/tp_scaling.svg" /></p>
|
| 882 |
|
| 883 |
<p>Impact of Tensor Parallelism on model performance and batch size capacity: while increasing TP leads to reduced per-GPU throughput (left), it enables processing of larger batch sizes (right), illustrating the trade-off between computational efficiency and memory availability in distributed training.</p>
|
| 884 |
|
|
|
|
| 886 |
|
| 887 |
<p>However, tensor parallelism provides important benefits for memory usage by distributing model parameters, gradients, optimizer states and activations (to some extent) across GPUs. Let's examine this effect on a 70B parameter model:</p>
|
| 888 |
|
| 889 |
+
<p><img alt="tp_memoryusage.svg" src="/assets/images/tp_memoryusage.svg" /></p>
|
| 890 |
|
| 891 |
<p>As we can see, increasing tensor parallelism reduces the memory needed for model parameters, gradients and optimizer states on each GPU. While tensor parallelism does help reduce activation memory in attention and feedforward layers by sharding the matrix multiplications across GPUs, we don't get the full memory benefits we could. This is because operations like layer normalization and dropout still require gathering the full activations on each GPU, partially negating the memory savings. We can do better by finding ways to parallelize these remaining operations as well.</p>
|
| 892 |
|
|
|
|
| 926 |
|
| 927 |
<p><img alt=" in forward: f = no-op ; f* = all-reduce ; g = all-gather ; g* = reduce-scatter
|
| 928 |
in backward: f = all-reduce ; f* = no-op ; g = reduce-scatter ; g* = all-gather
|
| 929 |
+
SP region needs full hidden_dim" src="/assets/images/tp_sp_diagram.png" /></p>
|
| 930 |
|
| 931 |
<p>in forward: f = no-op ; f<em> = all-reduce ; g = all-gather ; g</em> = reduce-scatter in backward: f = all-reduce ; f<em> = no-op ; g = reduce-scatter ; g</em> = all-gather SP region needs full hidden_dim</p>
|
| 932 |
|
|
|
|
| 947 |
|
| 948 |
<p>For sequence parallelism (SP), we use different operations labeled "g" and "g*". Specifically, we avoid using all-reduce in the SP region since that would require gathering the full activations and increase our peak memory usage, defeating the purpose of SP.</p>
|
| 949 |
|
| 950 |
+
<p><img alt="image.png" src="/assets/images/tp_sp_diagram_zoomed.png" /></p>
|
| 951 |
|
| 952 |
<p>So what is actually happening here? As a famous LLM would say, let’s take it step-by-step:</p>
|
| 953 |
|
|
|
|
| 1035 |
|
| 1036 |
<p>By using sequence parallelism, we can achieve even greater activation memory savings, allowing us to push our batch size and sequence length further than what would be possible with tensor parallelism alone. Let's see what that means for our previous 70B model example:</p>
|
| 1037 |
|
| 1038 |
+
<p><img alt="tp_sp_memoryusage.svg" src="/assets/images/tp_sp_memoryusage.svg" /></p>
|
| 1039 |
|
| 1040 |
<p>Does that mean that SP incurs more communication than TP? Well, yes and no. In the forward of a vanilla TP we had two all-reduce per transformer block, and in SP we have two all-gather and two reduce-scatter per transformer block. So SP does twice the number of communication operations as TP. But since an all-reduce operation can be broken down into to an all-gather + reduce-scatter (see in [TODO: Appendix link]) they’re actually equivalent in terms of communication. Same reasoning for backward as we just use the conjugate of each operation (no-op ↔ allreduce and allgather ↔ reducescatter).</p>
|
| 1041 |
|
| 1042 |
<p>If you’ve been paying close attention, you’ll notice that we’re talking about 4 comms ops in each layer (2 for Attention and 2 for MLP). This is how the MLP profiling looks like when using Tensor + Sequence Parallelism:</p>
|
| 1043 |
|
| 1044 |
+
<p><img alt="tp_sp_overlap.svg" src="/assets/images/tp_sp_overlap.svg" /></p>
|
| 1045 |
|
| 1046 |
<p>Besides the fact that TP requires communications in each layer, it also can’t easily be overlapped with compute, which makes throughput heavily dependent on the communication bandwidth. This is why TP is usually done only within a node (TP≤8).</p>
|
| 1047 |
|
|
|
|
| 1050 |
|
| 1051 |
<p>As you might expect, this communication overhead becomes increasingly problematic as we scale up tensor parallelism. To illustrate this, let’s check throughput as we scale TP with SP for a 3B model:</p>
|
| 1052 |
|
| 1053 |
+
<p><img alt="tp_sp_scaling.svg" src="/assets/images/tp_sp_scaling.svg" /></p>
|
| 1054 |
<p>Impact of combined Tensor and Sequence Parallelism (TP/SP) on a 3B model’s performance and memory utilization with 4096 seqlen: when scaling both TP and SP together, there's a trade-off between computational efficiency (left) and memory capacity (right). While higher parallelism degrees reduce per-GPU throughput, they enable processing of significantly larger batch sizes by reducing the activation memory.</p>
|
| 1055 |
|
| 1056 |
<p>Let’s summarize our observations:</p>
|
|
|
|
| 1080 |
|
| 1081 |
<p>Even if we use full recomputation of the activations, which comes at a heavy compute overhead (30%), we still need to hold in memory some activations at the layer boundaries which scale linearly with sequence length:</p>
|
| 1082 |
|
| 1083 |
+
<p><img alt="image.png" src="/assets/images/cp_memoryusage.svg" /></p>
|
| 1084 |
|
| 1085 |
<p>Can we apply similar ideas to our sequence parallelism approach but inside in the modules where we apply Tensor Parallelism already, thereby also reducing the effect of sequence length? Yes, it’s time to talk about Context Parallelism, which you will find quite intuitive after all we’ve already convered.</p>
|
| 1086 |
|
|
|
|
| 1088 |
|
| 1089 |
<p>The idea of Context Parallelism is quite simple; just like Sequence Parallelism, we’ll split the input along the sequence dimension but we now apply this splitting along the full model, instead of only the sequence parallel regions of the model as we’ve done previous with Tensor + Sequence Parallelism.</p>
|
| 1090 |
|
| 1091 |
+
<p><img alt="cp_8Bmemoryusage.svg" src="/assets/images/cp_8Bmemoryusage.svg" /></p>
|
| 1092 |
|
| 1093 |
<p>Splitting the sequence doesn't affect most modules like MLP and LayerNorm, where each token is processed independently. It also doesn’t require expensive communication like TP, as only the inputs are split and not the weight matrices. Just like data parallelism, after computing the gradients, an all-reduce operation is initiated to synchronize the gradients across the context parallelism group.</p>
|
| 1094 |
|
|
|
|
| 1119 |
|
| 1120 |
<p>The whole process with 4 GPUs is shown in the following animation:</p>
|
| 1121 |
|
| 1122 |
+
<p><img alt="ring-attention.gif" src="/assets/images/ring-attention.gif" /></p>
|
| 1123 |
|
| 1124 |
<p>With this animation, it’s also immediately clear why the authors chose to call this approach Ring Attention.</p>
|
| 1125 |
|
| 1126 |
<p>There is one big problem though which is that a naive implementation of Ring Attention lead to some strong imbalance between GPU streaming from the shape of the causal attention matrix. Let’s take a real look at what is happening in the SoftMax computation by considering the attention score matrix with the causal attention mask:</p>
|
| 1127 |
|
| 1128 |
+
<p><img alt="cp_attnmask.svg" src="/assets/images/cp_attnmask.svg" /></p>
|
| 1129 |
|
| 1130 |
<p>The SoftMax is computed row-wise, which means whenever a GPU has received all the tokens of a row it can be computed. We see that GPU1 can immediately compute it as it starts with tokens 1-4 and GPU1 actually doesn’t need to receive any information from any other GPUs. However, GPU2 will need to wait for the second round to also receive 1-4 and thus have all values for tokens 1-8. Also, GPU1 seems to perform much less work than all the other GPUs.</p>
|
| 1131 |
|
|
|
|
| 1135 |
|
| 1136 |
<p>We need a better way to distribute the input sequences. This can be achieved by assigning the tokens not purely sequential to the GPUs but by mixing the ordering a bit such that we have a good mix of early and late tokens on each GPU. This approach is called Zig-Zag attention<d-cite bibtex-key="attention brandon2023fasterring"></d-cite> and in this new arrangement, the attention mask will show an even distribution of computation but if you count the number of colored squares, you’ll see that the computation is now balanced across all GPUs.</p>
|
| 1137 |
|
| 1138 |
+
<p><img alt="cp_zigzagmask.svg" src="/assets/images/cp_zigzagmask.svg" /></p>
|
| 1139 |
|
| 1140 |
<p>At the same time we’ll also see that in order to complete all rows, each GPU will need information from all the other GPUs.</p>
|
| 1141 |
|
| 1142 |
<p>We have two general ways to overlap computation and communication, either by performing a general all-gather, regrouping all the KV on each GPUs at the same time (in a Zero-3 type of way) or we gather them one-by-one from each GPU to each GPU as needed:</p>
|
| 1143 |
|
| 1144 |
+
<p><img alt="cp_overlap_allgather.svg" src="/assets/images/cp_overlap_allgather.svg" /></p>
|
| 1145 |
+
<p><img alt="cp_overlap_all2all.svg" src="/assets/images/cp_overlap_all2all.svg" /></p>
|
| 1146 |
|
| 1147 |
<p>The key difference between these two implementations lies in their communication patterns and memory usage:</p>
|
| 1148 |
|
|
|
|
| 1152 |
<li>All GPUs simultaneously gather the complete key/value pairs from all other GPUs</li>
|
| 1153 |
<li>Requires more temporary memory as each GPU needs to store the full KV pairs at once</li>
|
| 1154 |
<li>Communication happens in one step but with larger memory overhead</li>
|
|
|
|
| 1155 |
</ul>
|
| 1156 |
|
| 1157 |
<p><strong>2. All-to-All (Ring) Implementation:</strong></p>
|
|
|
|
| 1160 |
<li>GPUs exchange KV pairs in a ring-like pattern, one chunk at a time</li>
|
| 1161 |
<li>More memory efficient as each GPU only needs to store one additional chunk temporarily</li>
|
| 1162 |
<li>Communication is spread out and overlapped with computation, though with some additional base latency overhead from multiple communication steps</li>
|
|
|
|
| 1163 |
</ul>
|
| 1164 |
|
| 1165 |
<p>The All-to-All approach generally offers better memory efficiency at the cost of slightly more complex communication patterns, while the AllGather approach is simpler but requires more temporary memory during the attention computation.</p>
|
|
|
|
| 1170 |
|
| 1171 |
<p>In the TP section we saw that if we try to scale Tensor parallelism past the number of GPUs per single node (typically 4 or 8) we hit a lower bandwidth network called “inter-node connection” which can quite strongly impair our performances. We can see this clearly on e.g. the all-reduce operation when we perform it across several nodes:</p>
|
| 1172 |
|
| 1173 |
+
<p><img alt="pp_comm_bandwidth.svg" src="/assets/images/pp_comm_bandwidth.svg" /></p>
|
| 1174 |
<p>Inter-node communication bandwidth measurements across different node counts, showing median (lines) and 5th-95th percentile ranges (shaded areas) for AllReduce, AllGather and ReduceScatter operations.</p>
|
| 1175 |
|
| 1176 |
<p>Sequence and context parallelism can help for long sequences but don’t help much if sequence length is not the root cause of our memory issues but rather the size of the model itself. For large model (70B+), the size of the weights alone can already push past the limits of the 4-8 GPUs on a single node. We can solve this issue by summoning the fourth (and last) parallelism dimension: “pipeline parallelism”.</p>
|
| 1177 |
|
| 1178 |
+
<p><img alt="pp_memoryusage.svg" src="/assets/images/pp_memoryusage.svg" /></p>
|
| 1179 |
|
| 1180 |
<p>Pipeline Parallelism is conceptually very simple –we’ll simply spread the layers of our model across GPUs – but the devil lies in implementing it efficiently. Let’s dive in it!</p>
|
| 1181 |
|
|
|
|
| 1189 |
|
| 1190 |
<p>Indeed reader! The main challenge in pipeline parallelism will be how to efficiently circumvent the sequential nature of PP to keep our GPU busy at all times and avoid having one GPU computing while the others are waiting. Here is how our GPU utilization is looking when doing a naive and simple forward and backward pass through the model where the numbers indicate the model layers:</p>
|
| 1191 |
|
| 1192 |
+
<p><img alt="image.png" src="/assets/images/pp_afab.svg" /></p>
|
| 1193 |
<p>An example of Pipeline parallelism for a model with 16 layers distributed across 4 GPUs. The numbers correspond to the layer IDs.</p>
|
| 1194 |
|
| 1195 |
<p>The remaining idle time is indicated in grey and usually called the “bubble” and the sight of this probably break your heart after we spent so much time optimizing throughput.</p>
|
|
|
|
| 1208 |
|
| 1209 |
<p>Let’s take a first tool out of our toolbox and think about splitting our batch into smaller bit-sized portions which can be processed in parallel or almost, like we did before in data parallel for instance. Now when the second GPU is busy processing micro-batch 1, the first GPU can already start processing micro-batch 2. Here is a schedule using 8 micro-batches:</p>
|
| 1210 |
|
| 1211 |
+
<p><img alt="pp_afab2.svg" src="/assets/images/pp_afab2.svg" /></p>
|
| 1212 |
|
| 1213 |
<aside>Before the numbers in the diagram indicated the layers but in all pipeline parallel plots from now including this one it indicates a microbatch. You can think of each square here to contain several layers as seen in the previous figure. </aside>
|
| 1214 |
|
|
|
|
| 1241 |
|
| 1242 |
<p>This schedule is called <strong><em>one-forward-one-backward (1F1B)</em></strong> as the middle/steady state involves alternatively performing one forward and one backward pass. The general idea is to start performing the backward pass as soon as possible. The schedule looks like this:</p>
|
| 1243 |
|
| 1244 |
+
<p><img alt="image.png" src="/assets/images/pp_1f1b.svg" /></p>
|
| 1245 |
|
| 1246 |
<p>The bubble still has the same size so our training efficiency is not significantly improved. However we only need to store activations for <d-math>p</d-math> micro-batches instead of <d-math>m</d-math> which quite reduce the activation memory explosion we had in the AFAB schedule. As a consequence we can add more microbatches which then will actually reduce the bubble.</p>
|
| 1247 |
|
| 1248 |
+
<!-- TODO: @Nouamane add this figure -->
|
| 1249 |
+
<p><img alt="image.png" src="/assets/images/pp_1f1b_scaling.png" /></p>
|
| 1250 |
|
| 1251 |
<p>A major complexity of this setup, visible on the above graph is how forward and backward passes are not cleanly consecutive anymore but performed in parallel across devices. This means we will have to schedule the switch from forward to backward passes independently on each device instead of in a simple and common central training loop as usual.</p>
|
| 1252 |
|
|
|
|
| 1277 |
|
| 1278 |
<p>This can be seen in general as a kind of “looping pipeline” where a micro-batch will move in circles from one GPU to the next as it goes through the forward pass through the model.</p>
|
| 1279 |
|
| 1280 |
+
<p><img alt="pp_1f1b_interleaved.svg" src="/assets/images/pp_1f1b_interleaved.svg" /></p>
|
| 1281 |
|
| 1282 |
<p>As a consequence we see additional communications happening as the model goes several times through each GPU for the same computation that previously just took one pass. However, each forward and backward pass is divided by a factor of <d-math>v</d-math>, where <d-math>v</d-math> is the number of stages or model chunks per GPUs as we are able to better interleave forward and backward passes. </p>
|
| 1283 |
|
|
|
|
| 1292 |
|
| 1293 |
<p>So we can now decrease the bubble by adding microbatches and interleaved stages, but note that quantitatively, the amount of communication also increases by <d-math>v</d-math> so it’s a trade off. In the following plot you can see several configurations for a PP setup with <d-math>p=8</d-math>, where the special case of <d-math>m=1, v=1</d-math> corresponds to naive pipeline parallelism and the configurations with <d-math>v=1</d-math> are AFAB or 1F1B setups and <d-math>v \neq 1</d-math> are interleaved configurations.</p>
|
| 1294 |
|
| 1295 |
+
<p><img alt="pp_bubblesize.png" src="/assets/images/pp_bubblesize.png" /></p>
|
| 1296 |
|
| 1297 |
|
| 1298 |
<p>Scheduling also becomes more complex here as we need to decide on a GPU whether we are prioritizing at a given moment earlier micro-batches meaning that we close the forward and backward loops as fast as possible (so called “depth-first”, i.e. prioritizing getting batches out of the model as fast as possible) or we prioritize to first complete the forward passes of all microbatches in the queue before going over to backward passes (so called “breadth-first” i.e. prioritizing filling in the pipeline as much as possible). This is explained in detail in the "Breadth-Fist Pipeline" paper<d-cite bibtex-key="lamypoirier2023breadthfirstpipelineparallelism"></d-cite>.</p>
|
| 1299 |
|
| 1300 |
<p>You now have all the elements to understand the pipeline parallelism approach in Llama 3.1 which is using a one-forward-one-backward setup with interleaved stages and a priority setting tuneable between depth-first and bread-first.</p>
|
| 1301 |
|
| 1302 |
+
<p><img alt="pp_llama3.1_schedule.png" src="/assets/images/pp_llama3.1_schedule.png" /></p>
|
| 1303 |
|
| 1304 |
<p>However, we haven’t reached the end of possible pipeline schedules and recently some methods have been proposed to reduce the bubble to virtually zero! Peaked your curiosity? Let’s have a look!</p>
|
| 1305 |
|
|
|
|
| 1308 |
<p>There are even more sophisticated ways to reduce the bubble more and reached close to a “zero bubble” regime. The secret here is to split at an even finer-grained level the operations involved in order to interleave them in the most efficient way. For instance the pipeline implementation approach in DeepSeek V3/R1, called DualPipe reach close to a zero bubble regime.</p>
|
| 1309 |
|
| 1310 |
<p>Let’s very quickly see how this can work by detailing briefly the ZeroBubble<d-cite bibtex-key="qi2023zerobubblepipelineparallelism"></d-cite> work which is a precursor to DualPipe. The base observation of ZeroBubble is that a backward through a matrix multiplication involve actually two separated operations: backward for the inputs (B) and the backward for the weights (W):</p>
|
| 1311 |
+
|
| 1312 |
+
<p><img alt="image.png" src="/assets/images/pp_zerobubble_compgraph.png" /></p>
|
| 1313 |
+
<p><img alt="image.png" src="/assets/images/pp_zerobubble_ppschedule.png" /></p>
|
| 1314 |
|
| 1315 |
<p>While the output of B, the backward pass for the input, is necessary for performing the backward pass of the lower layers, the backward pass of the weights, W, is not necessary for the rest of the backward pass and generally only need to be performed before the optimiser step. This means W can be flexibly scheduled anywhere after the corresponding B of the same stage. This allows for strategic placement of W to fill the pipeline bubbles. The ZB-H2 schedule on the top right is an example of (theoretical) schedule with zero bubble taking advantage for this fine-grained decomposition.</p>
|
| 1316 |
|
| 1317 |
<p>DeepSeek’s DualPipe introduced with V3 proposes an extension of this decomposed approach to the case of two stream propagating from both sides of the PP ranks and being interleaved to minimize even further idle time in the GPUs are displayed in the following scheduling graph:</p>
|
| 1318 |
|
| 1319 |
+
<p><img alt="image.png" src="/assets/images/pp_zerobubble_dualpipe.png" /></p>
|
| 1320 |
|
| 1321 |
<p>The ZeroBubble and DualPipe schedules are a bit too complex for us to give here code snippets but you should start to have a general idea of the concepts involved. In practice, optimizing these schedules requires careful measurements of the time for each operations followed by a scheduling algorithm able to find the most optimal allocation of time given the constrains. See for instance in the ZeroBubble paper<d-cite bibtex-key="qi2023zerobubblepipelineparallelism"></d-cite> for a discussion of the heuristics and algorithms to perform such a scheduling.</p>
|
| 1322 |
|
|
|
|
| 1327 |
|
| 1328 |
<p>Mixture-of-expert models have gained some traction with models such as Mixtral<d-cite bibtex-key="jiang2024mixtralexperts"></d-cite> or more recently DeepSeek-V3/R1! The basic idea is that instead of having a single feedforward module per layer we can have several and route tokens through different ones depending on their context:</p>
|
| 1329 |
|
| 1330 |
+
<p><img alt="ep_schema.png" src="/assets/images/ep_schema.png" /></p>
|
| 1331 |
<p>Source: A Survey on Mixture of Experts<d-cite bibtex-key="cai2024surveymixtureexperts"></d-cite> </p>
|
| 1332 |
|
| 1333 |
<p>This design makes it very easy to add a new parallelism paradigm: Expert parallelism (EP). Since the feedforward layers are fully independent we can simply put each expert’s feedforward layer on a different worker. Compared to TP it’s much more lightweight, since we don’t need to split the matrix multiplication, we just need to route the hidden states of a token to the right expert. There are several tricks to make EP work in practice, closely tied to model design. For instance, DeepSeek-V3 enforces a constraint in the router, ensuring that each token is sent to at most M nodes (in their case, 4) to reduce communication overhead.</p>
|
|
|
|
| 1460 |
|
| 1461 |
<p>And to have an idea of the memory benefits of each parallelism:</p>
|
| 1462 |
|
| 1463 |
+
<p><img alt="image.png" src="/assets/images/5Dparallelism_8Bmemoryusage.svg" /></p>
|
| 1464 |
|
| 1465 |
<h2>How to Find the Best Training Configuration</h2>
|
| 1466 |
|
|
|
|
| 1619 |
|
| 1620 |
<p>On the compute side, GPUs consist of an array of compute units called <strong>Streaming Multiprocessors</strong> (SM). Each SM contains and controls a set of streaming processors, also known as cores. For example, an Nvidia H100 GPU has 132 SMs with 128 cores per SM, resulting in a total of 16,896 cores (see <a href="https://resources.nvidia.com/en-us-tensor-core">docs for tensor cores</a> for details), each capable of handling multiple threads simultaneously.</p>
|
| 1621 |
|
| 1622 |
+
<p><img alt="image.png" src="/assets/images/diving_primergpu.svg" /></p>
|
| 1623 |
<p>TODO: Original figure from https://blog.codingconfessions.com/p/gpu-computing.</p>
|
| 1624 |
|
| 1625 |
<p>The memory side is also highly hierarchical with several layers of cache and memory: <strong>Registers</strong> are the smallest units and are private to the threads during executions, <strong>Shared Memory</strong> and <strong>L1 cache are</strong> shared between the threads running on a single SM, higher up is the <strong>L2 cache</strong> shared by all SMs, finally there is the <strong>Global Memory</strong> which is the largest memory on the GPU (the advertised 80 GB for a H100 for instance) but also the slowest to access and query.</p>
|
| 1626 |
|
| 1627 |
+
<p><img alt="image.png" src="/assets/images/diving_primergpu2.svg" /></p>
|
| 1628 |
<p>TODO: Original figure from https://www.youtube.com/watch?v=ZQKMZIP3Fzg</p>
|
| 1629 |
|
| 1630 |
<p>The goal of GPU will be to run as many workloads as possible, in parallel, on the GPU cores, by taking advantage of this hierarchical organization of compute/memory.</p>
|
|
|
|
| 1777 |
|
| 1778 |
<p>Here’s an excellent visualization of the kernel from this <a href="https://siboehm.com/articles/22/CUDA-MMM">fantastic blogpost</a>: </p>
|
| 1779 |
|
| 1780 |
+
<p><img alt="image.png" src="/assets/images/memorycoalescing.png" /></p>
|
| 1781 |
|
| 1782 |
<p>However, when profiling this kernel with a tool like <code>ncu</code>, we can see issues, including low memory throughput and uncoalesced memory accesses.</p>
|
| 1783 |
|
| 1784 |
+
<p><img alt="image.png" src="/assets/images/memorycoalescing2.png" /></p>
|
| 1785 |
+
<p><img alt="image.png" src="/assets/images/memorycoalescing3.png" /></p>
|
| 1786 |
|
| 1787 |
|
| 1788 |
<p>The reason for this is that in this kernel, two threads in the same block with Thread IDs <code>(0, 0)</code> and <code>(1, 0)</code> (which will end up in the same warp) will both load from the same column of matrix <code>B</code> but different rows of matrix <code>A</code>. Since matrix elements are stored in row-major order (meaning each row's elements are in consecutive memory addresses, as shown in the figure below), in the first iteration with <code>i = 0</code>, thread <code>(0, 0)</code> will load <d-math>A_{0,0}</d-math>, and thread <code>(1, 0)</code> will load <d-math>A_{1,0}</d-math>. These elements are not stored close to each other in memory, and this misalignment repeats across all iterations along the shared dimension, preventing memory accesses from being coalesced.</p>
|
| 1789 |
|
| 1790 |
+
<p><img alt="image.png" src="/assets/images/memorycoalescing4.png" /></p>
|
| 1791 |
|
| 1792 |
|
| 1793 |
<p>To improve our kernel we can change the way the coordinates x and y are calculated like the following : </p>
|
|
|
|
| 1809 |
|
| 1810 |
<p>When we profile our new kernel, we notice that the warning about uncoalesced memory accesses has disappeared, and <strong>the GPU's memory throughput has increased by approximately 10 times</strong>.</p>
|
| 1811 |
|
| 1812 |
+
<p><img alt="image.png" src="/assets/images/memorycoalescing5.png" /></p>
|
| 1813 |
|
| 1814 |
|
| 1815 |
<p>We also notice that the execution time of the kernel <strong>decreases by 10x</strong> !</p>
|
|
|
|
| 1825 |
|
| 1826 |
<p>In the tiling approach, each iteration involves all threads within a block cooperatively loading two tiles—one from matrix A and another from matrix B —into shared memory. Specifically, threads load a tile of matrix A (of size <code>BLOCK_SIZE_M</code> by <code>BLOCK_SIZE_K</code>) and a tile of matrix B (of size <code>BLOCK_SIZE_K</code> by <code>BLOCK_SIZE_N</code>). Once the tiles are in shared memory, the threads perform matrix multiplication on these tiles, enabling efficient computation since all necessary data is quickly accessible. The results of the tile multiplication are stored in an accumulation matrix that holds intermediate results. After each iteration, the results from the current tile multiplication are added to this accumulation matrix, continuing until all tiles from both matrices have been processed.</p>
|
| 1827 |
|
| 1828 |
+
<p><img alt="image.png" src="/assets/images/tiling.png" /></p>
|
| 1829 |
<p>From https://cnugteren.github.io/tutorial/pages/page4.html</p>
|
| 1830 |
|
| 1831 |
<p>The important parts to understand the implementation are below (for simplicity we consider a square shaped tile) : </p>
|
|
|
|
| 1870 |
|
| 1871 |
<p>The tiling technique has significantly improved the performance of our kernel. However, when analyzing the warp states which quantify how many cycles were spent in each state, we observe the following:</p>
|
| 1872 |
|
| 1873 |
+
<p><img alt="image.png" src="/assets/images/threadcoarsening.png" /></p>
|
| 1874 |
|
| 1875 |
|
| 1876 |
<p>The meaning of the states can be found in the <a href="https://docs.nvidia.com/nsight-compute/ProfilingGuide/index.html#metrics-reference">Profiling Guide</a>, specifically in the <strong>Warp Stall Reasons</strong> section. There we can read that:</p>
|
|
|
|
| 1892 |
<p>In several places now we’ve mentioned how GPU and CPU operation can be asynchronous. In particular, the host code on the CPU can schedule workload on the GPU in a non-blocking way.</p>
|
| 1893 |
|
| 1894 |
<p>Non-blocking can be useful for overlapping communication and computation as we saw at several part along this blog post but can be extended to the more general idea of trying to avoid at all cost going back and forth between host and GPU kernel commands. This is beautifully illustrated by <a href="https://horace.io/brrr_intro.html">Horace He</a> in these diagrams:</p>
|
| 1895 |
+
<div style="display: flex; gap: 20px; align-items: flex-start;">
|
| 1896 |
+
<div style="width: 50%;">
|
| 1897 |
+
<img alt="image.png" src="/assets/images/fused_kernels1.png" style="width: 100%;" />
|
| 1898 |
+
<p>A sequence of kernels requiring back and forth between global memory and compute units</p>
|
| 1899 |
+
</div>
|
| 1900 |
+
<div style="width: 50%;">
|
| 1901 |
+
<img alt="image.png" src="/assets/images/fused_kernels2.png" style="width: 100%;" />
|
| 1902 |
+
<p>Instead of sending our triangle back to global memory just to read it back again, we instead just do all of our operations in one go.</p>
|
| 1903 |
+
</div>
|
| 1904 |
+
</div>
|
| 1905 |
|
| 1906 |
<p>How can we avoid this back and forth? Well the best way is to make our GPU as autonomous as possible. This is achieved by packing as many successive compute operations together in a single kernel for the GPU to run, called a “Fused Kernel”.</p>
|
| 1907 |
|
|
|
|
| 1918 |
|
| 1919 |
<p>A basic implementation of the attention mechanism involve a lot of transfer between memory and workers. It requires materializing the S and P matrices in HBM which means that the results need to be sent to HBM and then back to SRAM for the next computations:</p>
|
| 1920 |
|
| 1921 |
+
<p><img alt="image.png" src="/assets/images/flashattn.png" /></p>
|
| 1922 |
|
| 1923 |
<p>Since bandwidth is much lower in HBM this introduces a severe bottleneck in the attention computation. Can we do better? Tri Dao says yes!</p>
|
| 1924 |
|
| 1925 |
<p>The key element is to compute the S matrices in small pieces which can fit in the smaller shared memory of the SM. But we can do even better and avoid materializing the very large S matrix all together in favor of keeping only the necessary statistics for computing the normalization factor of the softmax. So we can compute part of <d-math>O</d-math> directly in one computation in SRAM rather than moving intermediate results back and forth. In this case, not even do we make use of the shared memory but we also release the memory bottleneck resulting from materializing one of the largest activation matrices in the model (at long context length), the attention matrix.</p>
|
| 1926 |
|
| 1927 |
+
<p><img alt="image.png" src="/assets/images/flashattn2.png" /></p>
|
| 1928 |
<p>From the FLASH-ATTENTION paper<d-cite bibtex-key="dao2022flashattention"></d-cite></p>
|
| 1929 |
|
| 1930 |
<p>The idea of flash attention resolves so many bottlenecks in model training that it has quickly become the default way to perform attention in all transformers:</p>
|
|
|
|
| 2010 |
|
| 2011 |
<p>Reducing the total number of bits comes at a price (no free lunch here either), but we have some control over how to pay. Either we can sacrifice more bits on the mantissa or exponent. For this reason there exist also two float8 formats, named according to exponent and mantissa, to flexibly choose the most appropriate format. We can look at the possible range of numbers for each format:</p>
|
| 2012 |
|
| 2013 |
+
<p><img alt="image.png" src="/assets/images/mixedprecision.png" /></p>
|
| 2014 |
|
| 2015 |
|
| 2016 |
<p>We can see that float32 spans 80 orders of magnitude and float16 sacrifices a lot of range while bfloat16 maintains the full range. The two float8 formats reduce the range even further where e5e2 can maintain float16 range and e4m3 has an even smaller ranger.</p>
|
| 2017 |
|
| 2018 |
<p>How come some format are able to maintain the range and other not? Let’s investigate the resolution by plotting 10,000 points between 1 and 2. Each point will be rounded to the nearest representable number in each format:</p>
|
| 2019 |
|
| 2020 |
+
<p><img alt="image.png" src="/assets/images/mixedprecision_2.png" /></p>
|
| 2021 |
|
| 2022 |
<p>We can see here that bfloat16 maintained the range of float32 over float16 but did this with the cost of sacrificing more precision. In case of float8 the situation is even more dire as e4m3 can represent 7 and e5m2 only 3 number on the interval 1-2.</p>
|
| 2023 |
|
|
|
|
| 2055 |
|
| 2056 |
<p>The first, successful, very large scale training with FP8 mixed precision was publicly reported on DeepSeek-V3. The authors carefully analyzed each operation of the forward pass (Fprop) as well as the activation (Dgrad) and weight (Wgrad) backward pass. Similar to BF16 mixed precision training, some aggregation and master weights are kept in higher precision while the operations themselves are performed in FP8. </p>
|
| 2057 |
|
| 2058 |
+
<p><img alt="image.png" src="/assets/images/fp8_diagram.png" /></p>
|
| 2059 |
|
| 2060 |
<p>In order to switch from high precision (e.g. FP32 or BF16) to lower precision (e.g. FP16 or FP8) with smaller range, we need to normalize the range of values by computing the absolute maximum. DeepSeek-V3 also introduces a quantization scheme, where the ranges are normalized per tile: 1x128 for inputs/activations and 128x128 for weights and scale elements. This makes the normalization less susceptible to outliers. There is a number of additional tricks they deploy to also reduce the memory and communication footprint which you can follow in section 3.3. of the DeepSeek-V3 technical report<d-cite bibtex-key="deepseekai2024deepseekv3technicalreport"></d-cite>. </p>
|
| 2061 |
|
|
|
|
| 2149 |
|
| 2150 |
<p>Congratulations! You've completed quite a journey - from understanding how to train a simple model on a single GPU, all the way to mastering the complex techniques used to efficiently train massive language models like Llama-405B and DeepSeek-V3. By now, you should feel confident interpreting advanced parallelism diagrams like the one below, which would have seemed daunting when you first started.</p>
|
| 2151 |
|
| 2152 |
+
<p><img alt="image.png" src="/assets/images/conclusion_llama3_parallelism.png" /></p>
|
| 2153 |
|
| 2154 |
<p>In distributed training, many concepts sound easy enough when you first hear them, like “Pipeline parallelism just distributes layers on different GPUs”, but we also worked through all the challenging details when implementing those methods. </p>
|
| 2155 |
|
|
|
|
| 2199 |
|
| 2200 |
<p>First, let's examine this heatmap visualization:</p>
|
| 2201 |
|
| 2202 |
+
<p><img alt="image.png" src="/assets/images/what_we_learnt_heatmap.svg" /></p>
|
| 2203 |
<p>Heatmap visualization showing the optimal training configurations across different model sizes and compute node counts. For each combination, the configuration details include Data Parallelism (DP), Tensor Parallelism (TP), Pipeline Parallelism (PP), Gradient Accumulation Steps (GAS), Micro Batch Size (MBS), and ZeRO optimization stage. The color intensity indicates the Model FLOPs Utilization (MFU), with brighter colors representing higher efficiency.</p>
|
| 2204 |
|
| 2205 |
<p>To complement this, let's look at the relationships between different parameters:</p>
|
| 2206 |
|
| 2207 |
+
<!-- <p><img alt="image.png" src="/assets/images/what_we_learnt_parallel_coordinates.html" /></p> -->
|
| 2208 |
+
<iframe id="plotFrame" src="/assets/images/what_we_learnt_parallel_coordinates.html" height="540" width="1000" scrolling="no" frameborder="0"></iframe>
|
| 2209 |
+
|
| 2210 |
<p>Parallel coordinates plot showing the relationship between different model parallelism configurations (Data Parallel degree, Tensor Parallel degree, Pipeline Parallel degree), training hyperparameters (gradient accumulation steps, micro batch size), ZeRO stage and the resulting Model FLOPs Utilization (MFU). Each line represents a different training configuration, with colors indicating the MFU value - warmer colors show higher efficiency.</p>
|
| 2211 |
|
| 2212 |
<p>From these visualizations, we can draw several important insights:
|